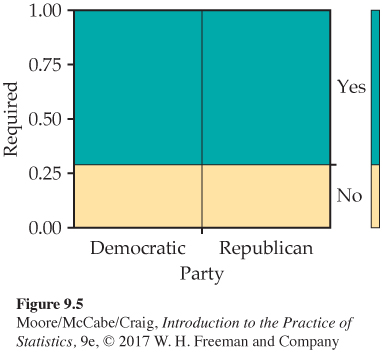
FIGURE 9.5
Mosaic plot for the vaccinations and political party scenario with expected counts in place of observed counts.
[
Leave
] [
Close
]
Next