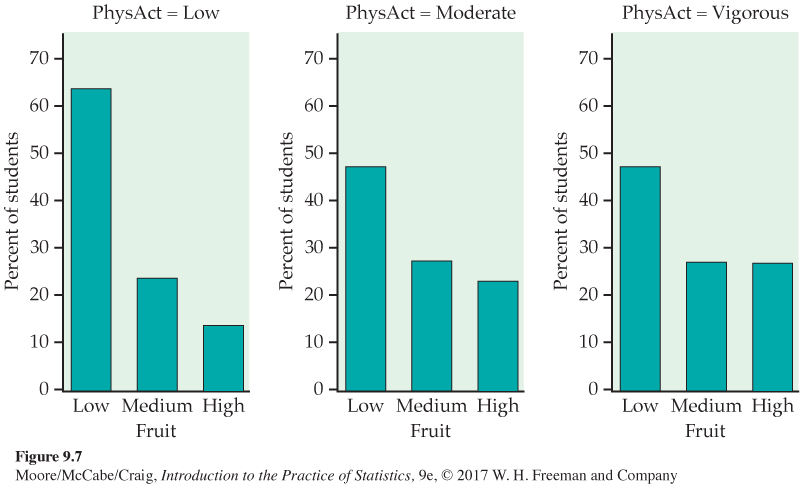
FIGURE 9.7
Comparison of the distribution of fruit consumption for different levels of physical activity,
Example 9.10
.
[
Leave
] [
Close
]
Next