SECTION 2.6 EXERCISES
For Exercise 2.113, see page 137; for 2.114, see page 138; for 2.115, see page 138; for 2.116, see page 140; for 2.117, see page 140; and for 2.118, see page 141.
Question 2.119
2.119 Does driver’s ed help? A study is planned to look at the effect of driver education programs on accidents. The driving records of all drivers under 18 in a given year will classify each driver as having taken a driver’s education course or not. The drivers will also classified with respect to the number of accidents that they had in the year after they received their license. The categories are zero, one, and two or more accidents.
(a) There are two variables in this study. Do you think one is an explanatory variable and the other is a response variable? Explain your answer.
(b) Sketch a two-way table that could be used to organize the data. Which variable is the row variable? Which variable is the column variable?
(c) How many cells are in the table? Describe in words what each of the cells will contain when the data are collected.
2.119 (a) Because they want to see the effect of driver’s education courses, that is the explanatory variable. The number of accidents is the response. (b) Driver’s Ed would be the column (x) variable, and number of accidents would be the row (y) variable. (c) There are six cells (two columns by three rows). For example, the first row, first column entry could be the number who took driver’s education and had 0 accidents.
Question 2.120
2.120 Music and video games. You are planning a study of undergraduates in which you will examine the relationship between listening to music and playing video games. The study subjects will be asked how much time they spend in each of these activities during a typical day. The choices for both activities will be a half hour or less, more than a half hour but less than an hour, and more than an hour.
(a) There are two variables in this study. Do you think one is an explanatory variable and the other is a response variable? Explain your answer.
(b) Sketch a two-way table that could be used to organize the data. Which variable is the row variable? Which variable is the column variable?
(c) How many cells are in the table? Describe in words what each of the cells will contain when the data are collected.
Question 2.121
2.121 Eight is enough. A healthy body needs good food, and healthy teeth are needed to chew our food so that it can nourish our bodies. The U.S. Army has recognized this fact and requires recruits to pass a dental examination. If you wanted to be a soldier in the Spanish American War, which took place in 1898, you needed to have at least eight teeth. Here is the statement of the requirement:
Unless an applicant has at least four sound double teeth, one above and one below on each side of the mouth, and so opposed as to serve the purpose of mastication, he should be rejected.
A study reported the rejection data for enlistment candidates classified by age. Here are the data:26
| Age | ||||||
|---|---|---|---|---|---|---|
| Rejected | Under 20 | 20 to 25 | 25 to 30 | 30 to 35 | 35 to 40 | Over 40 |
| Yes | 68 | 647 | 1114 | 1783 | 2887 | 3801 |
| No | 58,884 | 77,992 | 55,597 | 43,994 | 47,569 | 39,985 |
(a) Which variable is the explanatory variable? Which variable is the response variable? Give reasons for your answer.
(b) Find the joint distribution. Write a brief summary explaining the major features of this distribution.
(c) Find the two marginal distributions. Write a brief summary explaining the major features of these distributions.
(d) Which conditional distribution would you choose to explain the relationship between these two variables? Explain your answer.
(e) Find the conditional distribution that you chose in part (d), and write a summary that includes your interpretation of the relationship based on this conditional distribution.
2.121 (a) Age is the explanatory variable. Rejected is the response. With the dentistry available at that time, it’s reasonable to think that as a person got older, he would have lost more teeth.
(b)
| <20 | 20−25 | 25−30 | 30−35 | 35−40 | >40 | |
|---|---|---|---|---|---|---|
| Yes | 0.0002 | 0.0019 | 0.0033 | 0.0053 | 0.0086 | 0.0114 |
| No | 0.1761 | 0.2333 | 0.1663 | 0.1316 | 0.1423 | 0.1196 |
(c)
| Marginal distribution of “Rejected” | |
|---|---|
| Yes | No |
| 0.03081 | 0.96919 |
| Marginal distribution of age | |||||
|---|---|---|---|---|---|
| <20 | 20−25 | 25−30 | 30−35 | 35−40 | >40 |
| 0.1763 | 0.2352 | 0.1696 | 0.1369 | 0.1509 | 0.1310 |
(d) The conditional distribution of Rejected given Age, because we have said Age is the explanatory variable. (e) In the table, note that all columns sum to 1. We can clearly see the proportion of rejected recruits increasing with increasing age.
| <20 | 20−25 | 25−30 | 30−35 | 35−40 | >40 | |
|---|---|---|---|---|---|---|
| Yes | 0.0012 | 0.0082 | 0.0196 | 0.0389 | 0.0572 | 0.0868 |
| No | 0.9988 | 0.9918 | 0.9804 | 0.9611 | 0.9428 | 0.9132 |
Question 2.122
2.122 Survival and class on the Titanic. In Exercise 1.27 (page 24), you created a graphical summary of the number of passengers who survived classified by the accommodations that they had on the ship: first, second, or third class. Let’s look at these data with a two-way table.
(a) Create a two-way table that you could use to explore the relationship between survival and class.
(b) Which variable is the explanatory variable and which is the response variable? Give reasons for your answers.
(c) Find the two marginal distributions. Write a brief summary explaining the major features of these distributions.
(d) Which conditional distribution would you choose to explain the relationship between these two variables? Explain your answer.
Page 147(e) Find the conditional distribution that you chose in part (d) and, write a summary that includes your interpretation of the relationship based on this conditional distribution.
Question 2.123
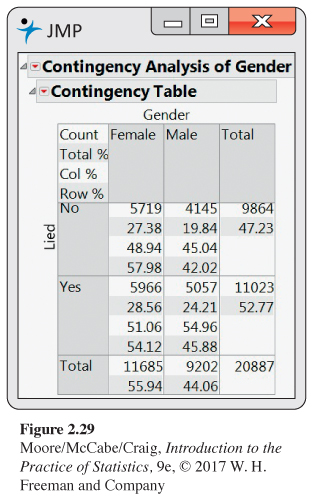
2.123 Lying to a teacher. One of the questions in a survey of high school students asked about lying to teachers.27 The data set LYING gives the numbers of students who said that they lied to a teacher about something significant at least once during the past year, classified by sex. Figure 2.29 gives software output for these data. Use this output to analyze these data and write a report summarizing your work. Be sure to include a discussion of whether or not you consider this relationship to involve an explanatory variable and a response variable.
2.123 Sex is the explanatory, Lied is the response. For the males, about 55% admitted that they lied, whereas for the females, 51% admitted that they had lied. Males maybe be slightly more willing to admit that they lied than females.
Question 2.124
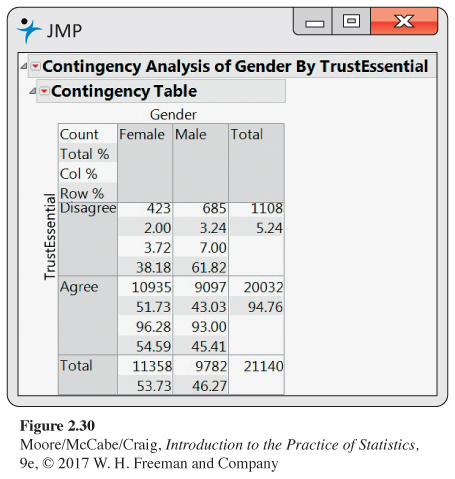
2.124 Trust and honesty in the workplace. The students surveyed in the study described in the previous exercise were also asked whether they thought trust and honesty were essential in business and the workplace. Figure 2.30 gives software output for these data. Use this output to analyze these data and write a report summarizing your work. Be sure to include a discussion of whether or not you consider this relationship to involve an explanatory variable and a response variable.
Question 2.125
2.125 Exercise and adequate sleep. A survey of 656 boys and girls, who were 13 to 18 years old, asked about adequate sleep and other health-related behaviors. The recommended amount of sleep is six to eight hours per night.28 In the survey, 59% of the respondents reported that they got less than this amount of sleep on school nights. An exercise scale was developed and used to classify the students as above or below the median in this domain. Here is the 2 × 2 table of counts with students classified as getting or not getting adequate sleep and by the exercise variable:
| Exercise | ||
|---|---|---|
| Enough sleep | High | Low |
| Yes | 151 | 115 |
| No | 148 | 242 |
(a) Find the distribution of adequate sleep for the high exercisers.
(b) Do the same for the low exercisers.
(c) Summarize the relationship between adequate sleep and exercise using the results of parts (a) and (b).
2.125 (a) 50.5% get enough sleep and 49.5% do not. (b) 32.2% get enough sleep and 67.8% do not. (c) Those who exercise more than the median are more likely to get enough sleep.
Question 2.126
2.126 Adequate sleep and exercise. Refer to the previous exercise.
(a) Find the distribution of exercise for those who get adequate sleep.
(b) Do the same for those who do not get adequate sleep.
(c) Write a short summary of the relationship between adequate sleep and exercise using the results of parts (a) and (b).
(d) Compare this summary with your summary from part (c) of the previous exercise. Which do you prefer? Give a reason for your answer.
Question 2.127
2.127 Which hospital is safer? Insurance companies and consumers are interested in the performance of hospitals. The government releases data about patient outcomes in hospitals that can be useful in making informed health care decisions. Here is a two-way table of data on the survival of patients after surgery in two hospitals. All patients undergoing surgery in a recent time period are included. “Survived” means that the patient lived at least six weeks following surgery.
| Hospital A | Hospital B | |
|---|---|---|
| Died | 63 | 16 |
| Survived | 2037 | 784 |
| Total | 2100 | 800 |
What percent of Hospital A patients died? What percent of Hospital B patients died? These are the numbers one might see reported in the media.
2.127 3.0% of Hospital A’s patients died, compared with 2.0% at B.
Question 2.128
2.128 Patients in “poor” or “good” condition. Refer to the previous exercise. Not all surgery cases are equally serious, however. Patients are classified as being in either “poor” or “good” condition before surgery. Here are the data broken down by patient condition. The entries in the original two-way table are just the sums of the “poor” and “good” entries in this pair of tables.
| Good condition | ||
|---|---|---|
| Hospital A | Hospital B | |
| Died | 6 | 8 |
| Survived | 594 | 592 |
| Total | 600 | 600 |
| Poor condition | ||
|---|---|---|
| Hospital A | Hospital B | |
| Died | 57 | 8 |
| Survived | 1443 | 192 |
| Total | 1500 | 200 |
(a) Find the death rate for Hospital A patients who were classified as “poor” before surgery. Do the same for Hospital B. In which hospital do “poor” patients fare better?
(b) Repeat part (a) for patients classified as “good” before surgery.
(c) What is your recommendation to someone facing surgery and choosing between these two hospitals?
(d) How can Hospital A do better in both groups, yet do worse overall? Look at the data and carefully explain how this can happen.
Question 2.129
2.129 Complete the table. Here are the row and column totals for a two-way table with two rows and two columns:
| a | b | 300 |
| c | d | 200 |
| 300 | 200 | 500 |
Find two different sets of counts a, b, c, and d for the body of the table that give these same totals. This shows that the relationship between two variables cannot be obtained from the two individual distributions of the variables.
2.129 In general, choose a to be any number from 0 to 300, and then all the other entries can be determined.
Question 2.130
2.130 Construct a table with no association. Construct a 3 × 4 table of counts where there is no apparent association between the row and column variables.