2.8 2.7 The Question of Causation*
When you complete this section, you will be able to:
• Identify the differences among causation, common response, and confounding in explaining an association.
• Apply the five criteria for establishing causation.
In many studies of the relationship between two variables, the goal is to establish that changes in the explanatory variable cause changes in the response variable. Even when a strong association is present, however, the conclusion that this association is due to a causal link between the variables is often hard to justify. What ties between two variables (and others lurking in the background) can explain an observed association? What constitutes good evidence for causation? We begin our consideration of these questions with a set of observed associations. In each case, there is a clear association between variable x and variable y. Moreover, the association is positive whenever the direction makes sense.
Explaining association
EXAMPLE 2.43
Observed associations. Here are some examples of observed association between x and y:
1. x = mother’s body mass index
y = daughter’s body mass index
2. x = amount of the artificial sweetener saccharin in a rat’s diet
y = count of tumors in the rat’s bladder
3. x = a student’s SAT score as a high school senior
y = a student’s first-year college grade point average
4. x = monthly flow of money into stock mutual funds
y = monthly rate of return for the stock market
5. x = whether a person regularly attends religious services
y = how long the person lives
6. x = the number of years of education a worker has
y = the worker’s income
Explaining association: Causation Figure 2.31 shows in outline form how a variety of underlying links between variables can explain association. The dashed double-arrow line represents an observed association between the variables x and y. Some associations are explained by a direct cause-and-effect link between these variables. The first diagram in Figure 2.31 shows “x causes y” by a solid arrow running from x to y.
![]()
Items 1 and 2 in Example 2.43 are examples of direct causation. Even when direct causation is present, very often it is not a complete explanation of an association between two variables. The best evidence for causation comes from experiments that actually change x while holding all other factors fixed. If y changes, we have good reason to think that x caused the change in y.
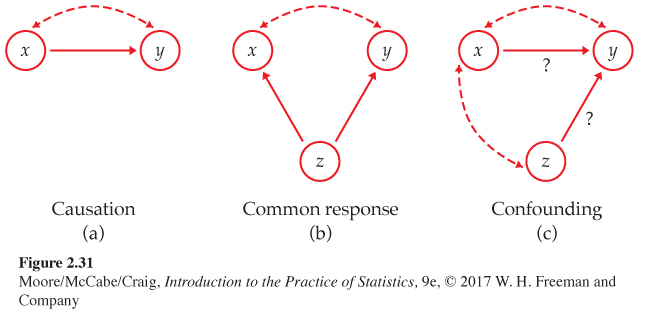
Explaining association: Common response “Beware of the lurking variable” is good advice when thinking about an association between two variables. The second diagram in Figure 2.31 illustrates common responsecommon response. The observed association between the variables x and y is explained by a lurking variable z. Both x and y change in response to changes in z. This common response creates an association even though there may be no direct causal link between x and y.
The third and fourth items in Example 2.43 illustrate how common response can create an association. What would be a good candidate for the variable z in these two examples?
Explaining association: Confounding For the first item in Example 2.43, we expect that inheritance explains part of the association between the body mass indexes (BMIs) of daughters and their mothers. Can we use r or r2 to say how much inheritance contributes to the daughters’ BMIs? No. It may well be that mothers who are overweight also set an example of little exercise, poor eating habits, and lots of television. Their daughters pick up these habits to some extent, so the influence of heredity is mixed up with influences from the girls’ environment. We call this mixing of influences confounding.
CONFOUNDING
Two variables are confounded when their effects on a response variable cannot be distinguished from each other. The confounded variables may be either explanatory variables or lurking variables or both.
![]()
When many uncontrolled variables are related to a response variable, you should always ask whether or not confounding of several variables prevents you from drawing conclusions about causation. The third diagram in Figure 2.31 illustrates confounding. Both the explanatory variable x and the lurking variable z may influence the response variable y. Because x is confounded with z, we cannot distinguish the influence of x from the influence of z. We cannot say how strong the direct effect of x on y is. In fact, it can be hard to say if x influences y at all.
The last two associations in Example 2.43 (Items 5 and 6) are explained in part by confounding. What would be a good candidate for the confounding variable z in these two examples?
Many observed associations are at least partly explained by lurking variables. Both common response and confounding involve the influence of a lurking variable (or variables) z on the response variable y. The distinction between these two types of relationship is less important than the common element, the influence of lurking variables. The most important lesson of these examples is one we have already emphasized: even a very strong association between two variables is not by itself good evidence that there is a cause-and-effect link between the variables.
Establishing causation
How can a direct causal link between x and y be established? The best method—indeed, the only fully compelling method—of establishing causation is to conduct a carefully designed experiment in which the effects of possible lurking variables are controlled. Chapter 3 explains how to design convincing experiments.
Many of the sharpest disputes in which statistics plays a role involve questions of causation that cannot be settled by experiment. Does gun control reduce violent crime? Does living near power lines cause cancer? Has “outsourcing” work to overseas locations reduced overall employment in the United States? All these questions have become public issues. All concern associations among variables. And all have this in common: they try to pinpoint cause and effect in a setting involving complex relations among many interacting variables. Common response and confounding, along with the number of potential lurking variables, make observed associations misleading. Experiments are not possible for ethical or practical reasons. We can’t assign some people to live near power lines or compare the same nation with and without strong gun controls.
EXAMPLE 2.44

Power lines and leukemia. Electric currents generate magnetic fields. So living with electricity exposes people to magnetic fields. Living near power lines increases exposure to these fields. Really strong fields can disturb living cells in laboratory studies. Some people claim that the weaker fields we experience if we live near power lines cause leukemia in children.
It isn’t ethical to do experiments that expose children to magnetic fields. It’s hard to compare cancer rates among children who happen to live in more and less exposed locations because leukemia is rare and locations vary in many ways other than magnetic fields. We must rely on studies that compare children who have leukemia with children who don’t.
A careful study of the effect of magnetic fields on children took five years and cost $5 million. The researchers compared 638 children who had leukemia and 620 who did not. They went into the homes and actually measured the magnetic fields in the children’s bedrooms, in other rooms, and at the front door. They recorded facts about nearby power lines for the family home and also for the mother’s residence when she was pregnant. Result: no evidence of more than a chance connection between magnetic fields and childhood leukemia.29
“No evidence” that magnetic fields are connected with childhood leukemia doesn’t prove that there is no risk. It says only that a careful study could not find any risk that stands out from the play of chance that distributes leukemia cases across the landscape. Critics continue to argue that the study failed to measure some lurking variables or that the children studied don’t fairly represent all children. Nonetheless, a carefully designed study comparing children with and without leukemia is a great advance over haphazard and sometimes emotional counting of cancer cases.
EXAMPLE 2.45
Smoking and lung cancer. Despite the difficulties, it is sometimes possible to build a strong case for causation in the absence of experiments. The evidence that smoking causes lung cancer is about as strong as nonexperimental evidence can be.
Doctors had long observed that most lung cancer patients were smokers. Comparison of smokers and similar nonsmokers showed a very strong association between smoking and death from lung cancer. Could the association be due to common response? Might there be, for example, a genetic factor that predisposes people both to nicotine addiction and to lung cancer? Smoking and lung cancer would then be positively associated even if smoking had no direct effect on the lungs. Or perhaps confounding is to blame. It might be that smokers live unhealthy lives in other ways (diet, alcohol, lack of exercise) and that some other habit confounded with smoking is a cause of lung cancer. How were these objections overcome?
Let’s answer this question in general terms: what are the criteria for establishing causation when we cannot do an experiment?
• The association is strong. The association between smoking and lung cancer is very strong.
• The association is consistent. Many studies of different kinds of people in many countries link smoking to lung cancer. That reduces the chance that a lurking variable specific to one group or one study explains the association.
• Higher doses are associated with stronger responses. People who smoke more cigarettes per day or who smoke over a longer period get lung cancer more often. People who stop smoking reduce their risk.
• The alleged cause precedes the effect in time. Lung cancer develops after years of smoking.
• The alleged cause is plausible. Experiments show that tars from cigarette smoke cause cancer when applied to the backs of mice.
Medical authorities do not hesitate to say that smoking causes lung cancer. The U.S. Surgeon General states that cigarette smoking is “the largest avoidable cause of death and disability in the United States.”30 The evidence for causation is strong—but it is not as strong as the evidence provided by well-designed experiments.