3.2 3.2 Design of Experiments
When you complete this section, you will be able to:
• Identify experimental units, subjects, treatments, and outcomes for an experiment.
• Identify a comparative experiment.
• Describe a placebo effect in an experiment.
• Identify bias in an experiment.
• Explain the need for a control group in an experiment.
• Explain the need for randomization in an experiment.
• When evaluating an experiment, apply the basic principles of experimental design: compare, randomize, and repeat.
• Use a table of random digits to randomly assign experimental units to treatments in an experiment.
• Use software to randomly assign experimental units to treatments in an experiment.
• Identify a matched pairs design.
• Identify a block design.
An experiment is a study in which we actually do something to people, animals, or objects in order to observe the response. Here is the basic vocabulary of experiments.
EXPERIMENTAL UNITS, SUBJECTS, TREATMENTS, AND OUTCOMES
The individuals on which the experiment is done are the experimental units. When the units are human beings, they are called subjects. Experimental conditions applied to the units are called treatments. The outcomes are the measured variables that are used to compare the treatments.
Because the purpose of an experiment is to reveal the response of one variable to changes in one or more other variables, the distinction between explanatory and response variables is important. The explanatory variables in an experiment are often called factorsfactors. Many experiments study the joint effects of several factors. In such an experiment, each treatment is formed by combining a specific value (often called a levellevel of a factor) of each of the factors.
EXAMPLE 3.8
Are smaller class sizes better? Do smaller classes in elementary school really benefit students in areas such as scores on standard tests, staying in school, and going on to college? We might do an observational study that compares students who happened to be in smaller classes with those who happened to be in larger classes in their early school years. Small classes are expensive, so they are more common in schools that serve richer communities. Students in small classes tend to also have other advantages: their schools have more resources, their parents are better educated, and so on. Confounding makes it impossible to isolate the effects of small classes.
The Tennessee STAR program was an experiment on the effects of class size. It has been called “one of the most important educational investigations ever carried out.” The subjects were 6385 students who were beginning kindergarten. Each student was assigned to one of three treatments: regular class (22 to 25 students) with one teacher, regular class (22 to 25 students) with a teacher and a full-time teacher’s aide, and small class (13 to 17 students). These treatments are levels of a single factor, the type of class. The students stayed in the same type of class for four years, then all returned to regular classes. In later years, students from the small classes had higher scores on the outcomes, standard tests. The benefits of small classes were greatest for minority students.8
lurking variables, p. 130
Example 3.8 illustrates the big advantage of experiments over observational studies. In principle, experiments can give good evidence for causation. In an experiment, we study the specific factors we are interested in while controlling the effects of lurking variables. All the students in the Tennessee STAR program followed the usual curriculum at their schools. Because students were assigned to different class types within their schools, school resources and family backgrounds were not confounded with class type. The only systematic difference was the type of class. When students from the small classes did better than those in the other two types, we can be confident that class size made the difference.
EXAMPLE 3.9
Repeated exposure to advertising. What are the effects of repeated exposure to an advertising message? The answer may depend both on the length of the ad and on how often it is repeated. An experiment investigated this question using undergraduate students as subjects. All subjects viewed a 40-minute television program that included ads for a digital camera. Some subjects saw a 30-second commercial; others, a 90-second version. The same commercial was shown either one, three, or five times during the program.

This experiment has two factors: length of the commercial, with two levels, and repetitions, with three levels. The six combinations of one level of each factor form six treatments. Figure 3.2 shows the layout of the treatments. After viewing the TV program, all the subjects answered questions about their recall of the ad, their attitude toward the camera, and their intention to purchase it. These are the outcomes.
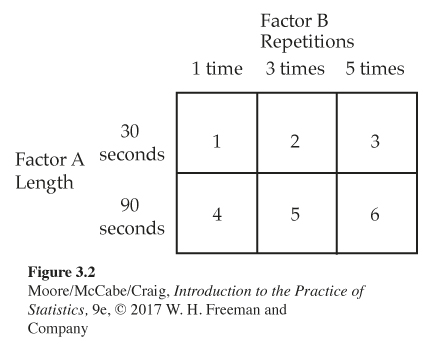
Example 3.9 shows how experiments allow us to study the combined effects of more than one factor. The interaction of several factors can produce effects that cannot be predicted from looking at the effects of each factor alone. Perhaps longer commercials increase interest in a product, and more commercials also increase interest, but if we both make a commercial longer and show it more often, viewers get annoyed and their interest in the product drops. The two-factor experiment in Example 3.9 will help us find out.
USE YOUR KNOWLEDGE
Question 3.17
3.17 Calcium and bones. Calcium is important for the growth of bone for children. In a study designed to understand how calcium is processed by the body, 40 young girls attended a summer camp where they were fed a controlled diet. The camp ran for two 3-week periods. For one period, the diet included a low amount of calcium. For the other period, there was a high amount of calcium in the diet. The researchers recorded the amount of calcium retained in the body for each girl. Explain why this study is an experiment and identify the experimental units, the treatments, and the response variable. Describe the factor and its levels.
3.17 (a) This is an experiment because the girls were assigned a controlled diet during the study period. The experimental units/subjects are the girls, the treatments are the two controlled diets (low and high calcium), the response is the amount of calcium retained. The factor in this instance is the same as the treatment, the diet assigned, and it has two levels—low and high calcium.
Question 3.18
3.18 Does echinacea reduce the severity of the common cold? In a study designed to evaluate the benefits of taking echinacea when you have a cold, 719 patients were randomly divided into four groups. The groups were (1) no pills, (2) pills that had no echinacea, (3) pills that had echinacea but the subjects did not know whether or not the pills contained echinacea, and (4) pills that had echinacea and the bottle containing the pills stated that the contents included echinacea. The outcome was a measure of the severity of the cold.9 Identify the experimental units, the treatments, and the outcome. Describe the factor and its levels. The study subjects were aged 12 to 80 years. To what extent do you think the results of this experiment can be generalized to young children?
Comparative experiments
Laboratory experiments in science and engineering often have a simple design with only a single treatment, which is applied to all experimental units. The design of such an experiment can be outlined as
Treatment → Observe response
For example, we may subject a beam to a load (treatment) and measure its deflection (observation). We rely on the controlled environment of the laboratory to protect us from lurking variables. When experiments are conducted outside the laboratory or with living subjects, such simple designs often yield invalid data. That is, we cannot tell whether the response was due to the treatment or to lurking variables.
EXAMPLE 3.10
Will writing about it reduce test anxiety? A study designed to reduce test anxiety had students write an essay about their feelings concerning an upcoming exam.10 The scores on this exam, the second of the semester, were compared with those on the first exam in the course. The mean scores on the second exam were higher than the mean scores on the first exam.
Write about feelings → Observe exam scores
The test anxiety experiment of Example 3.10 was poorly designed to evaluate the effect of the writing exercise. Perhaps exam scores would have increased on the second exam because the students became more familiar with the exam style of this particular instructor even without the writing exercise. Another possible explanation is that people typically respond to the personal attention that the students received by the person who explained how to write about their feelings regarding the exam.
In medical settings, this phenomenon is called the placebo effectplacebo effect. In medicine, a placebo is a dummy treatment, such as a sugar pill. People respond favorably to personal attention or to any treatment that they hope will help them. On the other hand, the writing exercise may have been very effective in improving exam scores. For this experiment, we don’t know whether the change was due to writing the essay, to the personal contacts with the study personnel, or to greater familiarity with the way the instructor designed exams.
The test anxiety experiment gave inconclusive results because the effect of writing the essay was confounded with other factors that could have had an effect on exam scores. The best way to avoid confounding is to do a comparative experimentcomparative experiment. Think about a study in which some students performed the writing exercise and others did not. A comparison of the exam scores of these two groups of students would provide an evaluation of the effect of the writing exercise.
In medical settings, it is standard practice to randomly assign patients either to a control groupcontrol group or a treatment grouptreatment group. All patients are treated the same in every way except that the treatment group receives the product that is being evaluated.
![]()
Uncontrolled experiments (that is, experiments that don’t include a control group) in medicine and the behavioral sciences can be dominated by such influences as the details of the experimental arrangement, the selection of subjects, and the placebo effect. The result is often bias.
BIAS
The design of a study is biased if it systematically favors certain outcomes.
An uncontrolled study of a new medical therapy, for example, is biased in favor of finding the treatment effective because of the placebo effect. Uncontrolled studies in medicine give new therapies a much higher success rate than proper comparative experiments do. Well-designed experiments usually compare several treatments.
USE YOUR KNOWLEDGE
Question 3.19
3.19 Does aspirin cure headaches? A study enrolled 100 college students who had frequent headaches to participate in a study to examine the effects of aspirin on their headaches. The students were instructed to take aspirin when they had a headache and to report whether there was a substantial relief from the headache pain within an hour.
(a) Explain why this study is biased.
(b) How would you change the study to remove the bias? Explain your answer.
3.19 (a) This study is biased because no control group was used. Therefore, the placebo effect may be present. (b) To remove the bias, two treatment groups should be used, one with the aspirin and a control group that receives a placebo.
Question 3.20
3.20 Are the teacher evaluations biased? The evaluations of two instructors by their students are compared when it is time to decide raises for the coming year. One teacher always hands out the evaluation forms in class when the grades on the first exam are given to the students. The other instructor always hands out the evaluation forms at the end of a class in which a very interesting film clip is shown. Discuss the possibility of bias in this context.
Randomization
The design of an experimentexperimental design first describes the response variable or variables, the factors (explanatory variables), and the treatments, with comparison as the leading principle. Figure 3.2 (page 173) illustrates this aspect of the design of a study of response to advertising. The second aspect of experimental design is how the experimental units are assigned to the treatments. Comparison of the effects of several treatments is valid only when all treatments are applied to similar groups of experimental units. If one corn variety is planted on more fertile ground or if one cancer drug is given to more seriously ill patients, comparisons among treatments are meaningless. If groups assigned to treatments are quite different in a comparative experiment, we should be concerned that our experiment will be biased. How can we assign experimental units to treatments in a way that is fair to all treatments?
Experimenters often attempt to match groups by elaborate balancing acts. Medical researchers, for example, try to match the patients in a “new drug” experimental group and a “standard drug” control group by age, sex, physical condition, smoker or not, and so on. Matchingmatching is helpful but not adequate—there are too many lurking variables that might affect the outcome. The experimenter is unable to measure some of these variables and will not think of others until after the experiment.
Some important variables, such as how advanced a cancer patient’s disease is, are so subjective that they can’t be measured. In other cases, an experimenter might unconsciously bias a study by assigning those patients who seemed the sickest to a promising new treatment in the (unconscious) hope that it would help them.
The statistician’s remedy is to rely on chance to make an assignment that does not depend on any characteristic of the experimental units and that does not rely on the judgment of the experimenter in any way. The use of chance can be combined with matching, but the simplest experimental design creates groups by chance alone. Here is an example.
EXAMPLE 3.11

Which smartphone should be marketed? Two teams have each prepared a prototype for a new smartphone. Before deciding which one will be marketed, the smartphones will be evaluated by college students. Forty students will receive a new phone. They will use it for two weeks and then answer some questions about how well they like the phone. The 40 students will be randomized, with 20 receiving each phone.
This experiment has a single factor (prototype) with two levels. The researchers must divide the 40 student subjects into two groups of 20. To do this in a completely unbiased fashion, put the names of the 40 students in a hat, mix them up, and draw 20. These students will receive Phone 1, and the remaining 20 will receive Phone 2. Figure 3.3 outlines the design of this experiment.
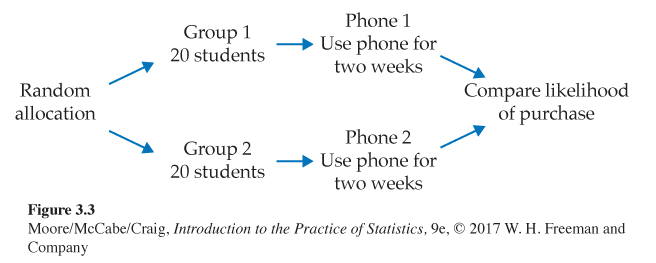
The use of chance to divide experimental units into groups is called randomizationrandomization. The design in Figure 3.3 combines comparison and randomization to arrive at the simplest randomized comparative design. This “flowchart” outline presents all the essentials: randomization, the sizes of the groups and which treatment they receive, and the response variable. There are, as we will see later, statistical reasons for using treatment groups that are about equal in size.
USE YOUR KNOWLEDGE
Question 3.21
3.21 Diagram the echinacea experiment. Refer to Exercise 3.16 (page 171). Draw a diagram similar to Figure 3.3 that describes the experiment.
Question 3.22
3.22 Diagram the aspirin experiment. Draw a diagram similar to Figure 3.3 that describes the experiment you suggested in part (b) of Exercise 3.19 (page 175).
Randomized comparative experiments
The logic behind the randomized comparative design in Figure 3.3 is as follows:
• Randomization produces two groups of subjects that we expect to be similar in all respects before the treatments are applied.
• Comparative design helps ensure that influences other than the characteristics of the smartphone operate equally on both groups.
• Therefore, differences in the satisfaction with the smartphone must be due either to the characteristics of the phone or to the chance assignment of subjects to the two groups.
That “either-or” deserves more comment. We cannot say that all the difference in the satisfaction with the two smartphones is caused by the characteristics of the phones. There would be some difference even if both groups used the same phone. Some students would be more likely to be highly favorable of any new phone. Chance can assign more of these students to one of the phones so that there is a chance difference between the groups. We would not trust an experiment with just one subject in each group, for example. The results would depend too much on which phone got lucky and received the subject who was more likely to be highly satisfied. If we assign many students to each group, however, the effects of chance will average out. There will be little difference in the satisfaction between the two groups unless the phone characteristics cause a difference. “Use enough subjects to reduce chance variation” is the third big idea of statistical design of experiments.
PRINCIPLES OF EXPERIMENTAL DESIGN
The basic principles of statistical design of experiments are
1. Compare two or more treatments. This will control the effects of lurking variables on the response.
2. Randomize—use chance to assign experimental units to treatments.
3. Repeat each treatment on many units to reduce chance variation in the results.
How to randomize
The idea of randomization is to assign subjects to treatments by drawing names from a hat. In practice, experimenters use software to carry out randomization. For example, most statistical software can choose five out of a list of 10 at random. The list might contain the names of 10 human subjects to be randomly assigned to two groups. The five chosen form one group, and the five that remain form the second group. The Simple Random Sample applet on the text website makes it particularly easy to choose treatment groups at random.
![]()
When we randomize, we first give a labellabel to each in the collection of items to be randomized. The label could be the name of a subject in a clinical study or simply a numerical identification number. We then perform the randomization using software or a table of random numbers. To illustrate these methods, let’s randomize 10 subjects for a study that will compare a treatment with a placebo control. We will randomly select the five subjects for the treatment group, and the remaining subjects will receive the placebo. We start by labeling the subjects with the numbers 1 through 10.
Randomization using software
uniform distribution, p. 71
Here is an example of one way to do the randomization using Excel. We start with a spreadsheet that has 10 rows corresponding to 10 subjects to be randomized to treatment or placebo.
The basic idea is that we generate a uniform random variable for each subject. In Excel, we use the RAND() function for this step. Then we sort the spreadsheet by the column with the uniform numbers and select the first five labels to be the treatment group and the remaining labels to be the placebo controls.
This process is essentially the same as writing the labels on a deck of 10 cards. We then shuffle the cards and deal five cards to form the treatment group.
EXAMPLE 3.12
Using software for the randomization. First create a data set with the numbers 1 to 10 in the first column. See Figure 3.4(a). Then we use RAND() to generate 10 random numbers in the second column. See Figure 3.4(b). Finally, we sort the data set based on the numbers in the second column. See Figure 3.4(c). The first five labels (7, 3, 4, 2, and 9) will receive the treatment. The remaining five labels (10, 6, 8, 1, and 5) will receive the placebo control.
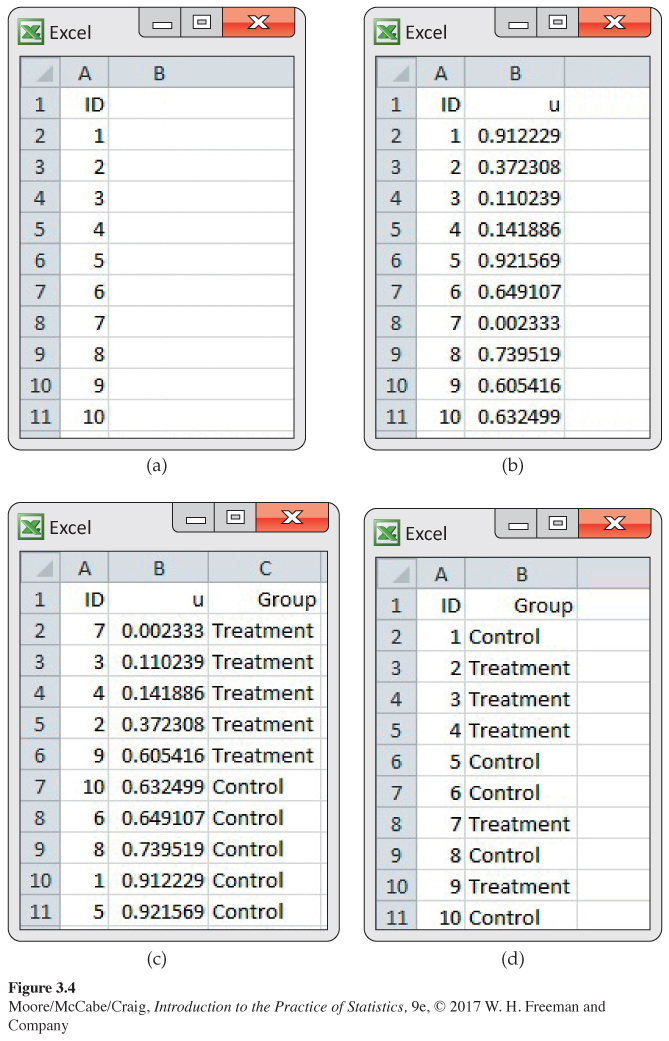
If you want to save the uniform numbers that you generated in your file, you should copy them to another column using the “paste values” option before you perform the sort. Note that we have added a column called Group to the spreadsheet, which gives the group to which each subject is assigned. With this variable included, we can now sort the file on ID and delete the column with the random numbers. The result is shown in Figure 3.4(d). The spreadsheet in this form can now be used as a template for entering data.
Randomization using random digits
You can randomize without software by using a table of random digits. Thinking about random digits helps you to understand randomization even if you will use software in practice. Table B at the back of the book is a table of random digits.
RANDOM DIGITS
A table of random digits is a list of the digits 0, 1, 2, 3, 4, 5, 6, 7, 8, 9 that has the following properties:
1. The digit in any position in the list has the same chance of being any one of 0, 1, 2, 3, 4, 5, 6, 7, 8, 9.
2. The digits in different positions are independent in the sense that the value of one has no influence on the value of any other.
You can think of Table B as the result of asking an assistant (or a computer) to mix the digits 0 to 9 in a hat, draw one, then replace the digit drawn, mix again, draw a second digit, and so on. The assistant’s mixing and drawing save us the work of mixing and drawing when we need to randomize. Table B begins with the digits 19223950340575628713. To make the table easier to read, the digits appear in groups of five and in numbered rows. The groups and rows have no meaning—the table is just a long list of digits having Properties 1 and 2 described earlier.
Our goal is to use random digits for experimental randomization. We need the following facts about random digits, which are consequences of Properties 1 and 2:
• Any pair of random digits has the same chance of being any of the 100 possible pairs: 00, 01, 02, . . . , 98, 99.
• Any triple of random digits has the same chance of being any of the 1000 possible triples: 000, 001, 002, . . . , 998, 999.
• . . . and so on for groups of four or more random digits.
EXAMPLE 3.13
Randomize the subjects. Let’s use random digits to perform the randomization that we performed using Excel in Example 3.12. Because the labels range from 1 to 10, we can use two digits for our labels
01, 02, 03, 04, 05, 06, 07, 08, 09, 10
when we select random digits from Table B. We could also have changed our labels to 0 through 9 and then we would only need to use single digits from Table B.
Start anywhere in Table B and read two-digit groups. Suppose we begin at line 175, which is
80011 09937 57195 33906 94831 10056 42211 65491
The first 10 two-digit groups in this line are
80 01 10 99 37 57 19 53 39 06
Each of these two-digit groups is a label. The labels 00 and 11 to 99 are not used in this example, so we ignore them. The first 10 labels between 01 and 10 that we encounter in the table choose subjects who will receive the treatment. Of the first 10 labels in line 175, we ignore seven because they are too high (over 10). The others are 01, 10, and 06. Continue across line 175 and 176 and verify that the next two subjects selected correspond to labels 03 and 04. Our randomization has selected subjects 1, 3, 4, 6, and 10 to receive the treatment. The remaining subjects, 2, 5, 7, 8, and 9 will receive the placebo control.
When all experimental units are allocated at random among all treatments, as in Examples 3.12 and 3.13, the experimental design is completely randomizedcompletely randomized design. Completely randomized designs can compare any number of treatments. The treatments can be formed by levels of a single factor or by more than one factor.
EXAMPLE 3.14
Randomization for the TV commercial experiment. Figure 3.2 (page 173) displays six treatments formed by the two factors in an experiment on response to a TV commercial. Suppose that we have 150 students who are willing to serve as subjects. We must assign 25 students at random to each group. Figure 3.5 outlines the completely randomized design.
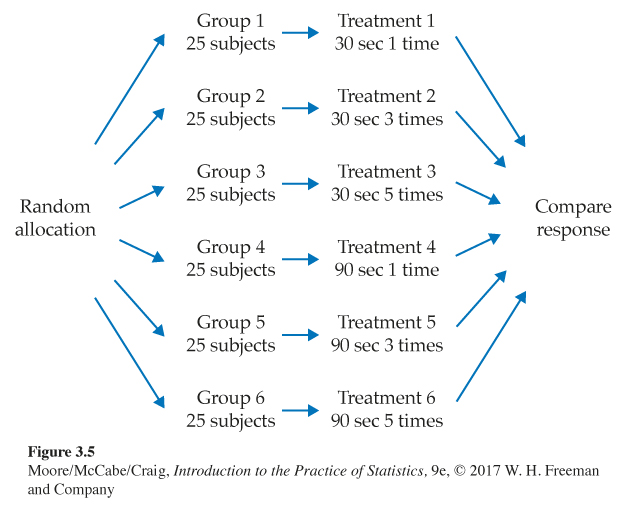
To carry out the random assignment, label the 150 students 001 to 150. (Three digits are needed to label 150 subjects.) Using Excel, we would generate a uniform random variable for each label and sort the file as we did in Example 3.12. The first 25 students in this sorted file will receive Treatment 1, the next 25 will receive Treatment 2, etc.
Using random digits, we could enter Table B and read three-digit groups until you have selected 25 students to receive Treatment 1 (a 30-second ad shown once). If you start at line 140, the first few labels for Treatment 1 subjects are 129, 048, and 003.
Continue in Table B to select 25 more students to receive Treatment 2 (a 30-second ad shown three times). Then select another 25 for Treatment 3 and so on until you have assigned 125 of the 150 students to Treatments 1 through 5. The 25 students who remain get Treatment 6.
![]()
The randomization is straightforward but very tedious to do by using random digits. We strongly recommend that you use software, such as Excel or the Simple Random Sample applet. Exercise 3.37 (page 187) shows how to use the applet to do the randomization for this example.
USE YOUR KNOWLEDGE
Question 3.23
3.23 Do the randomization. Use computer software to carry out the randomization in Example 3.14. Show your work by including the random uniform numbers in your final spreadsheet.
Cautions about experimentation
The logic of a randomized comparative experiment depends on our ability to treat all the experimental units identically in every way except for the actual treatments being compared. Good experiments, therefore, require careful attention to details. The ideal situation is where a study is double-blinddouble-blind—neither the subjects themselves nor the experimenters know which treatment any subject has received. The double-blind method avoids unconscious bias by, for example, a doctor who doesn’t think that “just a placebo” can benefit a patient.
![]()
Many—perhaps most—experiments have some weaknesses in detail. The environment of an experiment can influence the outcomes in unexpected ways. Although experiments are the gold standard for evidence of cause and effect, really convincing evidence usually requires that a number of studies in different places with different details produce similar results. Here are some brief examples of what can go wrong.
EXAMPLE 3.15
Placebo for a marijuana experiment. A study of the effects of marijuana recruited young men who used marijuana. Some were randomly assigned to smoke marijuana cigarettes, while others were given placebo cigarettes. This failed: the control group recognized that their cigarettes were phony and complained loudly. It may be quite common for blindness to fail because the subjects can tell which treatment they are receiving.11
The most serious potential weakness of experiments is lack of realismlack of realism. The subjects or treatments or setting of an experiment may not realistically duplicate the conditions we really want to study. Here is an example.
EXAMPLE 3.16
Layoffs and feeling bad. How do layoffs at a workplace affect the workers who remain on the job? To try to answer this question, psychologists asked student subjects to proofread text for extra course credit, then “let go” some of the workers (who were actually accomplices of the experimenters). Some subjects were told that those let go had performed poorly (Treatment 1). Others were told that not all could be kept and that it was just luck that they were kept and others let go (Treatment 2). We can’t be sure that the reactions of the students are the same as those of workers who survive a layoff in which other workers lose their jobs. Many behavioral science experiments use student subjects in a campus setting. Do the conclusions apply to the real world?
![]()
Lack of realism can limit our ability to apply the conclusions of an experiment to the settings of greatest interest. Most experimenters want to generalize their conclusions to some setting wider than that of the actual experiment. Statistical analysis of an experiment cannot tell us how far the results will generalize to other settings. Nonetheless, the randomized comparative experiment, because of its ability to give convincing evidence for causation, is one of the most important ideas in statistics.
Matched pairs designs
Completely randomized designs are the simplest statistical designs for experiments. They illustrate clearly the principles of control, randomization, and repetition. However, completely randomized designs are often inferior to more elaborate statistical designs. In particular, matching the subjects in various ways can produce more precise results than simple randomization.
The simplest use of matching is a matched pairs designmatched pairs design, which compares just two treatments. The subjects are matched in pairs. For example, an experiment to compare two advertisements for the same product might use pairs of subjects with the same age, sex, and income. The idea is that matched subjects are more similar than unmatched subjects so that comparing responses within a number of pairs is more efficient than comparing the responses of groups of randomly assigned subjects. Randomization remains important: which one of a matched pair sees the first ad is decided at random. One common variation of the matched pairs design imposes both treatments on the same subjects so that each subject serves as his or her own control. Here is an example.
EXAMPLE 3.17
Matched pairs for the smartphone prototype experiment. Example 3.11 describes an experiment to compare two prototypes of a new smartphone. The experiment compared two treatments: Phone 1 and Phone 2. The response variable is the satisfaction of the college student participant with the new smartphone. In Example 3.11, 40 student subjects were assigned at random, 20 students to each phone. This is a completely randomized design, outlined in Figure 3.3. Subjects differ in how satisfied they are with smartphones in general. The completely randomized design relies on chance to create two similar groups of subjects.
If we wanted to do a matched pairs version of this experiment, we would have each college student use each phone for two weeks. An effective design would randomize the order in which the phones are evaluated by each student. This will eliminate bias due to the possibility that the first phone evaluated will be systematically evaluated higher or lower than the second phone evaluated.
The completely randomized design uses chance to decide which subjects will evaluate each smartphone prototype. The matched pairs design uses chance to decide which 20 subjects will evaluate Phone 1 first. The other 20 will evaluate Phone 2 first. This experiment is called a cross-overcross-over experiment. Situations where there are more than two treatments and all subjects receive all treatments can also be performed in this way.
Block designs
The matched pairs design of Example 3.17 uses the principles of comparison of treatments, randomization, and repetition on several experimental units. However, the randomization is not complete (all subjects randomly assigned to treatment groups) but is restricted to assigning the order of the treatments for each subject. Block designs extend the use of “similar subjects” from pairs to larger groups.
BLOCK DESIGN
A block is a group of experimental units or subjects that are known before the experiment to be similar in some way that is expected to affect the response to the treatments. In a block design, the random assignment of units to treatments is carried out separately within each block.
Block designs can have blocks of any size. A block design combines the idea of creating equivalent treatment groups by matching with the principle of forming treatment groups at random. Blocks are another form of control. They control the effects of some outside variables by bringing those variables into the experiment to form the blocks. Here are some typical examples of block designs.
EXAMPLE 3.18
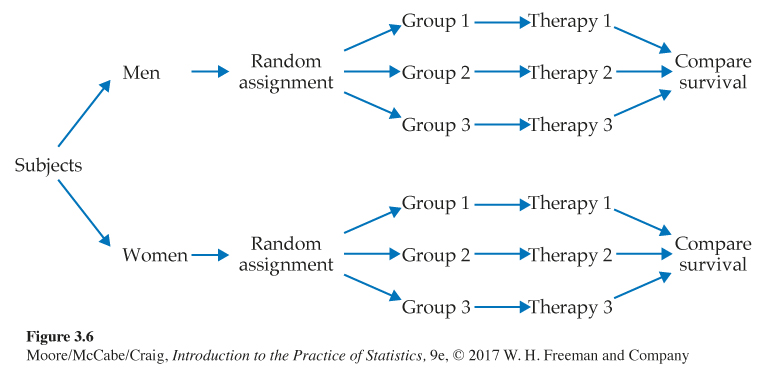
Blocking in a cancer experiment. The progress of a type of cancer differs in women and men. A clinical experiment to compare three therapies for this cancer then treats sex as a blocking variable. Two separate randomizations are done, one assigning the female subjects to the treatments and the other assigning the male subjects. Figure 3.6 outlines the design of this experiment. Note that there is no randomization involved in making up the blocks. They are groups of subjects who differ in some way (sex in this case) that is apparent before the experiment begins.
EXAMPLE 3.19
Blocking in an agriculture experiment. The soil type and fertility of farmland differ by location. Because of this, a test of the effect of tillage type (two types) and pesticide application (three application schedules) on soybean yields uses small fields as blocks. Each block is divided into six plots, and the six treatments are randomly assigned to plots separately within each block.
EXAMPLE 3.20
Blocking in an education experiment. The Tennessee STAR class size experiment (Example 3.8, page 172) used a block design. It was important to compare different class types in the same school because the children in a school come from the same neighborhood, follow the same curriculum, and have the same school environment outside class. In all, 79 schools across Tennessee participated in the program. That is, there were 79 blocks. New kindergarten students were randomly placed in the three types of class separately within each school.
Blocks allow us to draw separate conclusions about each block, for example, about men and women in the cancer study in Example 3.18. Blocking also allows more precise overall conclusions because the systematic differences between men and women can be removed when we study the overall effects of the three therapies. The idea of blocking is an important additional principle of statistical design of experiments. A wise experimenter will form blocks based on the most important unavoidable sources of variability among the experimental units. Randomization will then average out the effects of the remaining variation and allow an unbiased comparison of the treatments.