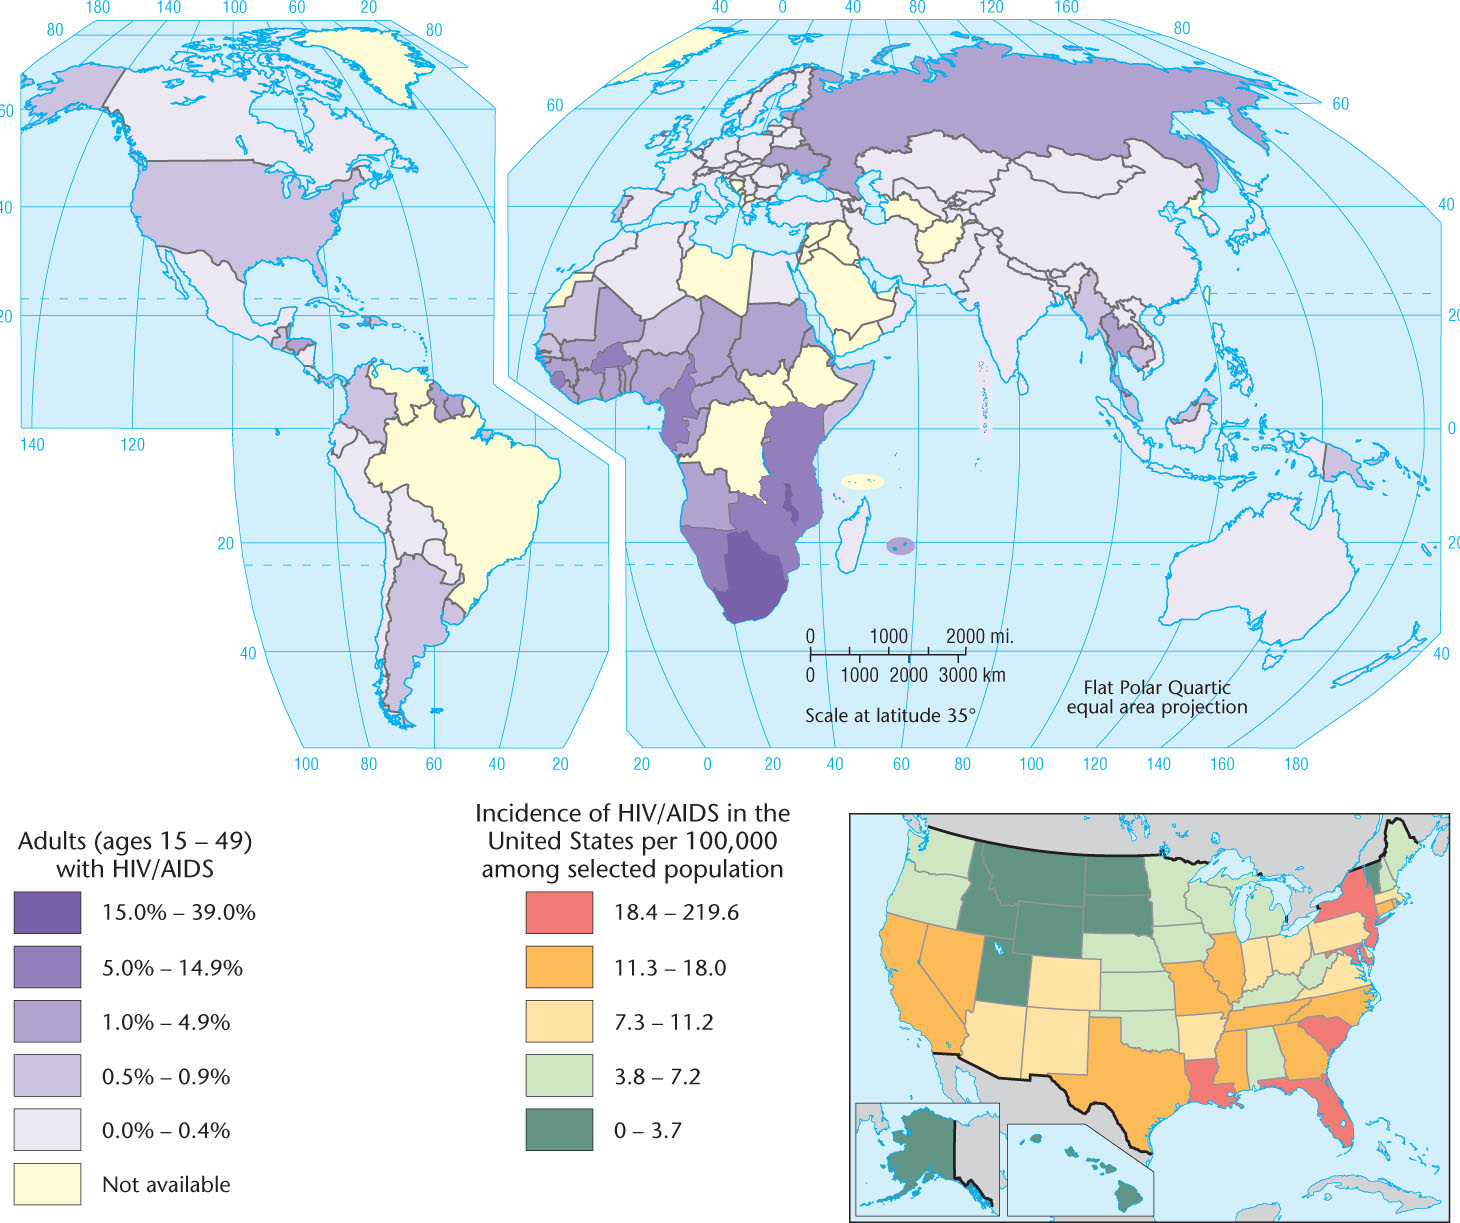
Figure 3.5: The geography of HIV/AIDS, shown as the percent of adults aged 15 to 49 with HIV/AIDS in 2009. The quality of data gathering varies widely from one country to another and is particularly poor in Africa and most of Asia. The U.S. map shows the incidence of HIV/AIDS per 100,000 people.