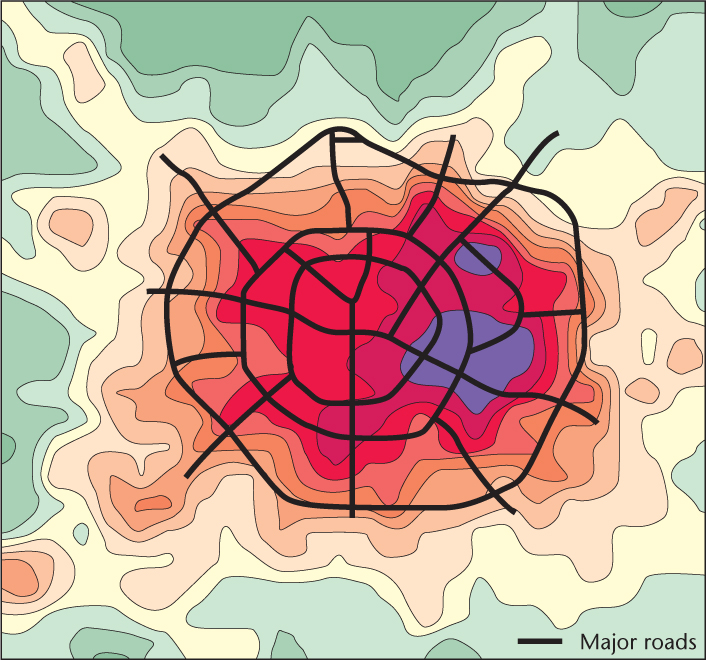
Figure 11.16: Diagram of the urban heat island in Chengdu, China. The deep colors (purples and red) indicate higher temperatures, while the shades of yellow and green indicate lower temperatures. Notice the marked contrast in temperature between the built-up part of the city and the surrounding rural areas.
(Source: Shangming and Bo, 2001.)