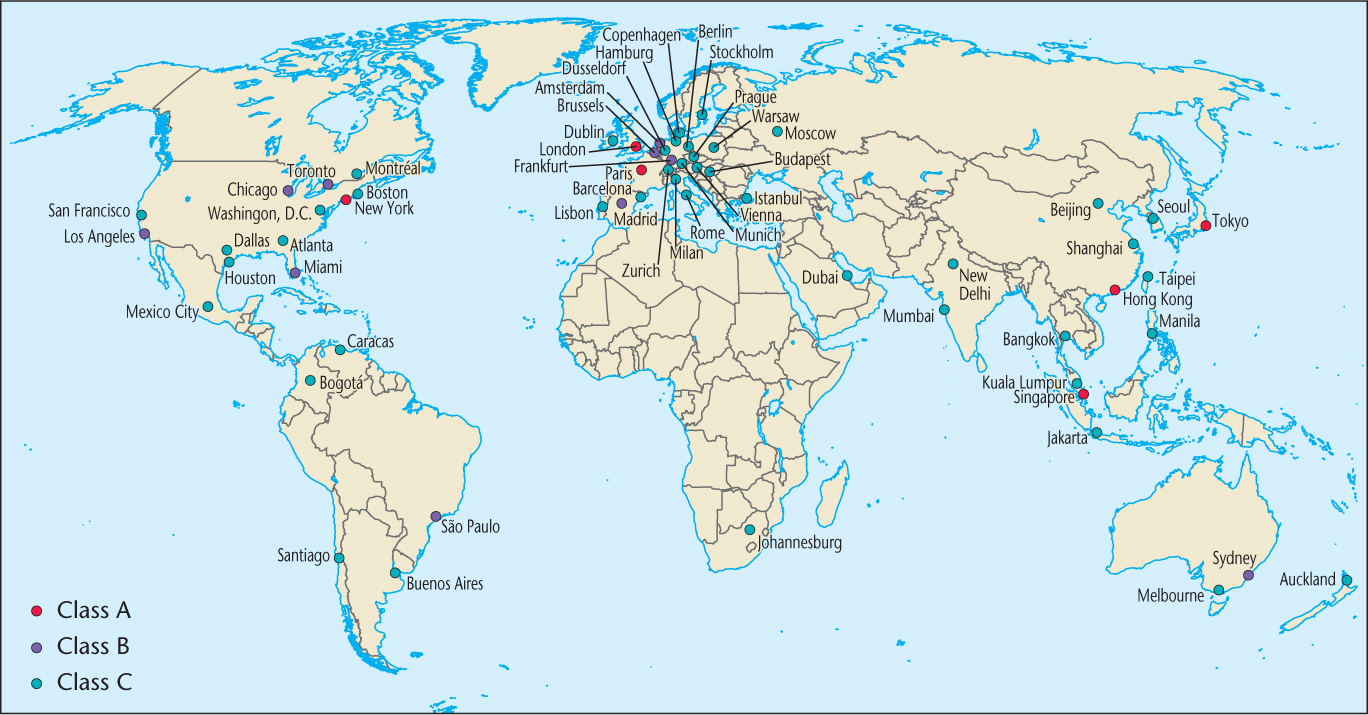
Figure 10.8:
The top 60 international cities in the world of class A, B, and C. This map indicates the location of cities that contain international producer service firms. Class A cities contain over 88 percent of the 100 international firms that were surveyed, class B cities host over 70 percent of the same firms, and class C cities contain over 44 percent of those firms.
(Source: Yefang Huang, Yee Leung, and Jianfa Shen, 2007.)