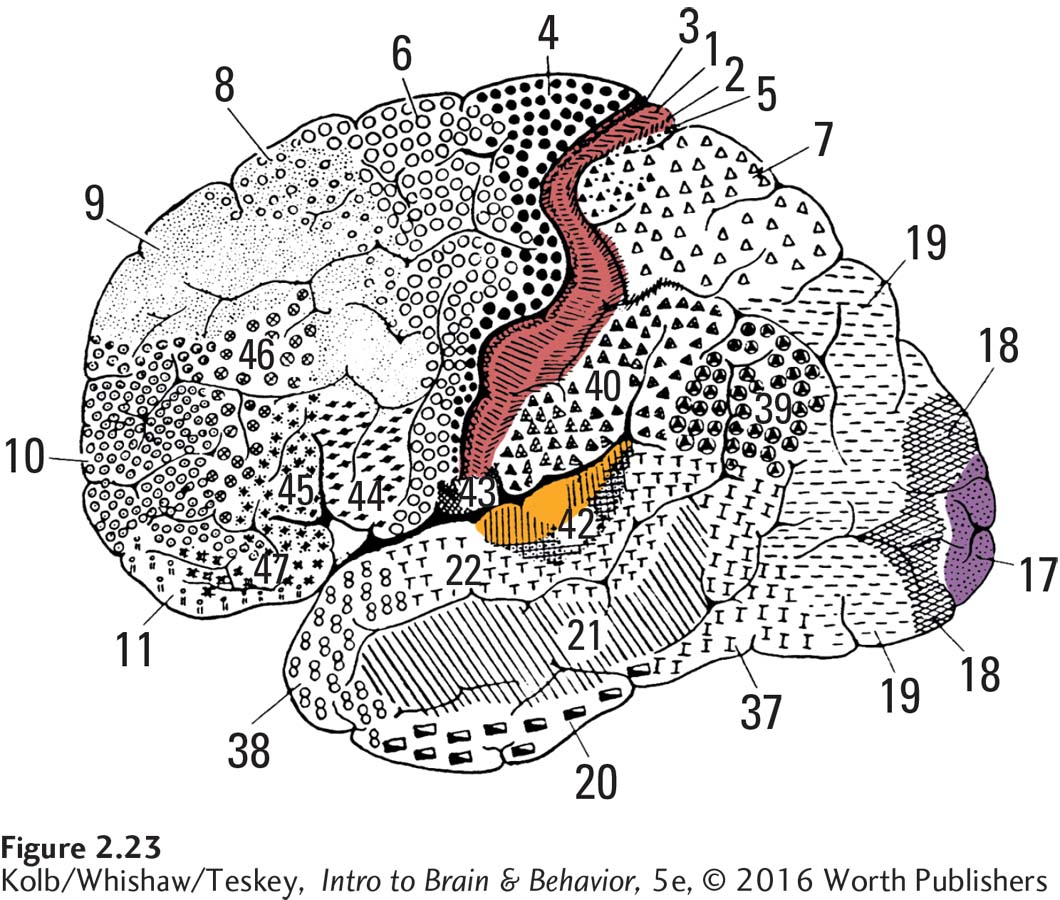
FIGURE 2- 23 Early Brain MAP In his cytoarchitectonic MAP of the cortex, Brodmann (1909) defined areas by the organization and characteristics of the cells he examined. The regions shown in color are associated with the simplest sensory perceptions of touch (red), vision (purple), and hearing (orange). As we shall see, the cortical areas that process sensory information are far more extensive than Brodmann’s basic areas.