| Figure 3.2 | Increasing Opportunity Cost |
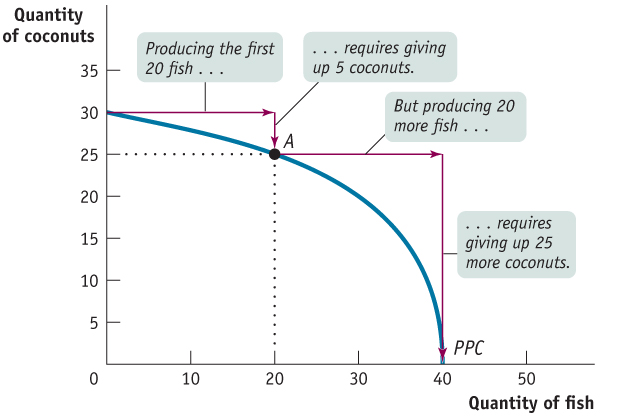
Increasing Opportunity CostThe bowed- out shape of the production possibilities curve reflects increasing opportunity cost. In this example, to produce the first 20 fish, Tom must give up 5 coconuts. But to produce an additional 20 fish, he must give up 25 more coconuts.
[Leave] [Close]