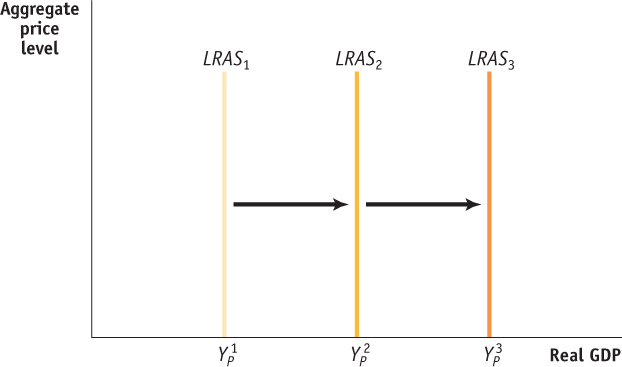
Figure 40.5
Lon
g-
Run Growth and the
LRAS
Curve
Lon
g-
Run Growth and the
LRAS
Curve
The growth in potential output over time can be shown as a rightward shift of the lon
g-
run aggregate supply curve.
[
Leave
] [
Close
]
Next