| Figure 49.6 | The Supply Curve for Used Textbooks |
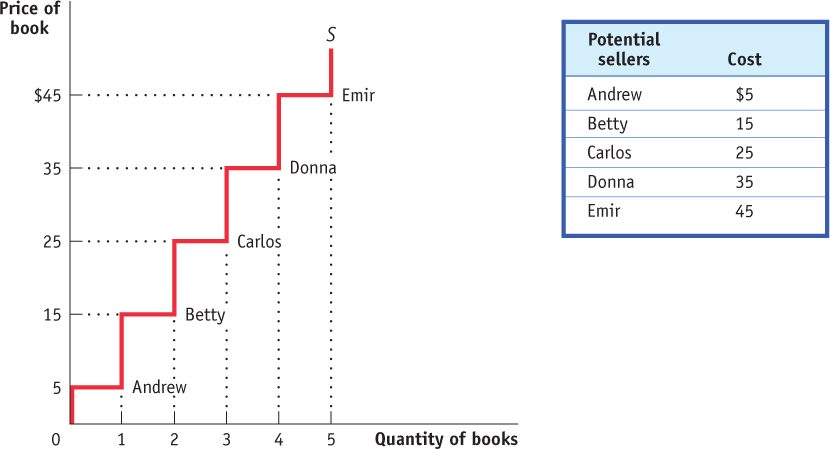
The Supply Curve for Used TextbooksThe supply curve illustrates sellers’ cost, the lowest price at which a potential seller is willing to sell the good, and the quantity supplied at that price. Each of the five students has one book to sell and each has a different cost, as indicated in the accompanying table. At a price of $5 the quantity supplied is one (Andrew), at $15 it is two (Andrew and Betty), and so on until you reach $45, the price at which all five students are willing to sell.
[Leave] [Close]