| Figure 51.3 | Optimal Consumption Bundle |
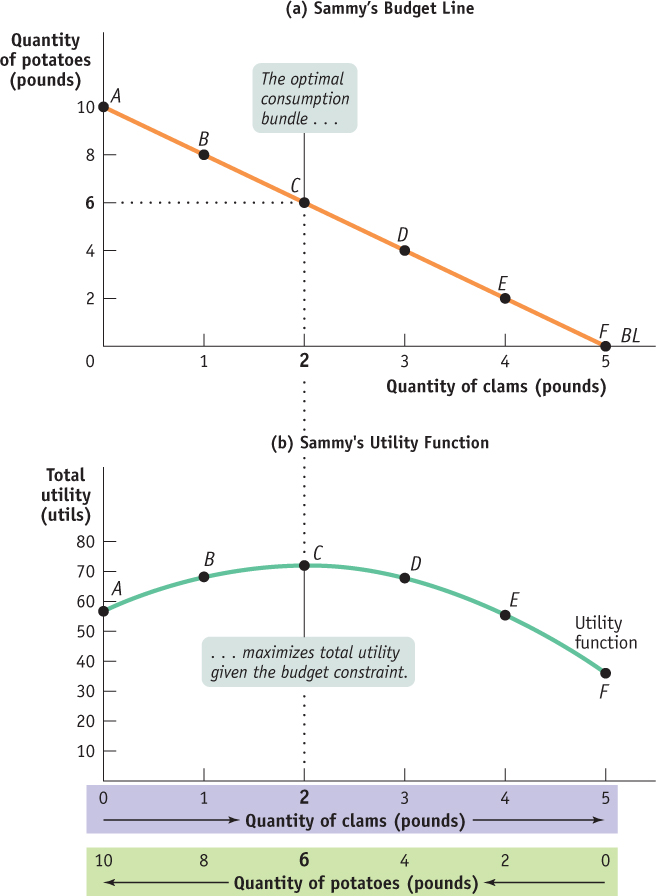
Optimal Consumption BundlePanel (a) shows Sammy’s budget line and his six possible consumption bundles. Panel (b) shows how his total utility is affected by his consumption bundle, which must lie on his budget line. The quantity of clams is measured from left to right on the horizontal axis, and the quantity of potatoes is measured from right to left. As he consumes more clams, due to his fixed budget, he must consume fewer potatoes. As a result, the quantity of potatoes decreases as the quantity of clams increases. His total utility is maximized at bundle C, where he consumes 2 pounds of clams and 6 pounds of potatoes. This is Sammy’s optimal consumption bundle.
[Leave] [Close]