| Figure 69.4 | Shifts of the Marginal Revenue Product Curve |
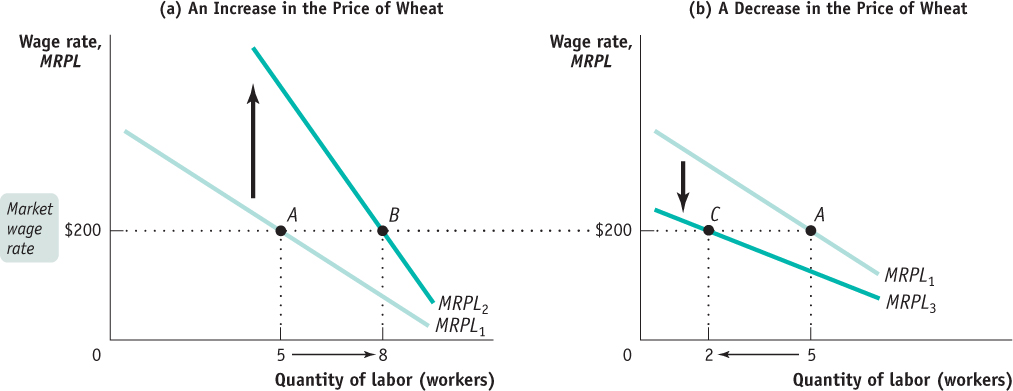
Shifts of the Marginal Revenue Product CurvePanel (a) shows the effect of an increase in the price of wheat on George and Martha’s demand for labor. The increase in price (and thus marginal revenue) shifts the marginal revenue product of labor curve upward from MRPL1 to MRPL2. If the market wage rate remains at $200, the profit- maximizing quantity of labor rises from 5 workers to 8 workers, shown by the movement from point A to point B. Panel (b) shows the effect of a decrease in the price of wheat. The marginal revenue product of labor curve shifts downward, from MRPL1 to MRPL3. At the market wage rate of $200, the profit- maximizing quantity of labor falls from 5 workers to 2 workers, shown by the movement from point A to point C.
[Leave] [Close]