The Circular-Flow Diagram
AP® Exam Tip
Be prepared to draw the simple circular-flow diagram with two markets and three sectors on the AP® exam. Make sure you use the proper terms between markets, firms, and households.
To understand the principles behind the national accounts, it helps to look at a graphic called a circular-flow diagram. This diagram is a simplified representation of the macroeconomy. It shows the flows of money, goods and services, and factors of production through the economy. It allows us to visualize the key concepts behind the national accounts. The underlying principle is that the flow of money into each market or sector is equal to the flow of money coming out of that market or sector.
The Simple Circular-Flow Diagram The U.S. economy is a vastly complex entity, with more than a hundred million workers employed by millions of companies, producing millions of different goods and services. Yet you can learn some very important things about the economy by considering a simple diagram, shown in Figure 10.1. This simple model of the macroeconomy represents the transactions that take place by two kinds of flows around a circle: flows of physical things such as goods, services, labor, or raw materials in one direction, and flows of money that pay for these things in the opposite direction. In this case, the physical flows are shown in yellow and the money flows are shown in green.
| Figure 10.1 | The Circular-Flow Diagram |
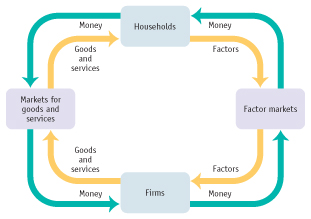
Figure 10.1: The Circular-Flow DiagramThis diagram represents the flows of money, factors of production, and goods and services in the economy. In the markets for goods and services, households purchase goods and services from firms, generating a flow of money to the firms and a flow of goods and services to the households. The money flows back to households as firms purchase factors of production from the households in factor markets.
Page 106
A household is a person or group of people who share income.
A firm is an organization that produces goods and services for sale.
Product markets are where goods and services are bought and sold.
The simplest circular-flow diagram illustrates an economy that contains only two kinds of “inhabitants”: households and firms. A household consists of either an individual or a group of people who share their income. A firm is an organization that produces goods and services for sale—and that employs members of households.
As you can see in Figure 10.1, there are two kinds of markets in this simple economy. On one side (here the left side) there are markets for goods and services (also known as product markets) in which households buy the goods and services they want from firms. This produces a flow of goods and services to the households and a return flow of money to the firms.
Factor markets are where resources, especially capital and labor, are bought and sold.
On the other side, there are factor markets in which firms buy the resources they need to produce goods and services. The best known factor market is the labor market, in which workers are paid for their time. Besides labor, we can think of households as owning the other factors of production and selling them to firms.
This simple circular-flow diagram omits a number of real-world complications in the interest of simplicity. However, the diagram is a useful aid to thinking about the economy—and we can use it as the starting point for developing a more realistic (and therefore more complicated) circular-flow diagram.
The Expanded Circular-Flow Diagram Figure 10.2 is a revised and expanded circular-flow diagram. This diagram shows only the flows of money in the economy, but is expanded to include extra elements that were ignored in the interest of simplicity in Figure 10.1. The underlying principle that the inflow of money into each market or sector must equal the outflow of money coming from that market or sector still applies in this model.
Page 107
| Figure 10.2 | An Expanded Circular-Flow Diagram: How Money Flows Through the Economy |
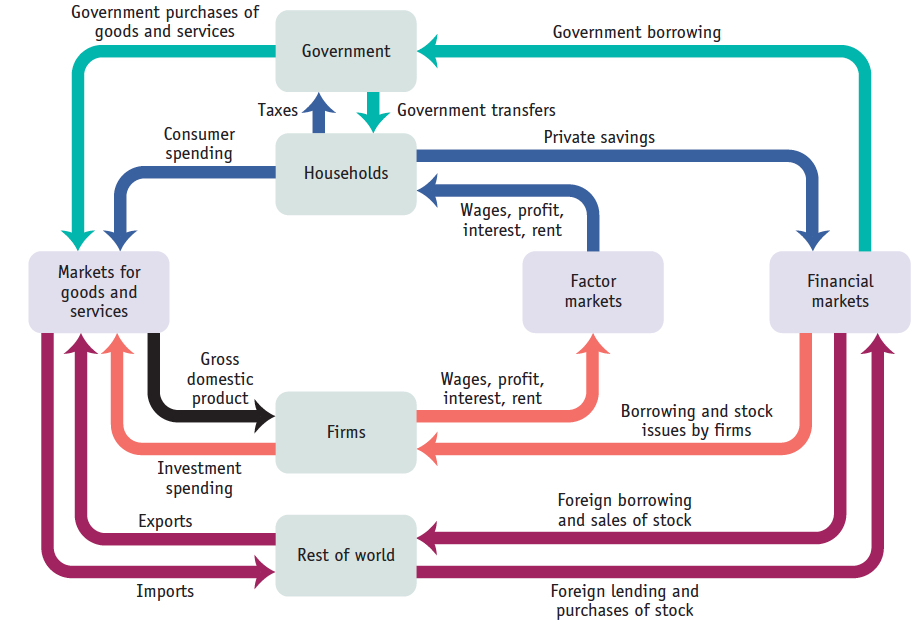
Figure 10.2: An Expanded Circular-Flow Diagram: How Money Flows Through the EconomyA circular flow of funds connects the four sectors of the economy—households, firms, government, and the rest of the world—via three types of markets: the factor markets, the markets for goods and services, and the financial markets. Funds flow from firms to households in the form of wages, profit, interest, and rent through the factor markets. After paying taxes to the government and receiving government transfers, households allocate the remaining income—disposable income—to private savings and consumer spending. Via the financial markets, private savings and funds from the rest of the world are channeled into investment spending by firms, government borrowing, foreign borrowing and lending, and foreign transactions of stocks. In turn, funds flow from the government and households to firms to pay for purchases of goods and services. Finally, exports to the rest of the world generate a flow of funds into the economy and imports lead to a flow of funds out of the economy. We can determine the total flow of funds by adding all spending—consumer spending on goods and services, investment spending by firms, government purchases of goods and services, and exports—and then subtracting the value of imports. This is the value of all the final goods and services produced in the United States—that is, the gross domestic product of the economy.
Consumer spending is household spending on goods and services.
A stock is a share in the ownership of a company held by a shareholder.
A bond is a loan in the form of an IOU that pays interest.
In Figure 10.2, the circular flow of money between households and firms illustrated in Figure 10.1 remains. In the product markets, households engage in consumer spending, buying goods and services from both domestic firms and firms in the rest of the world. Households receive money as owners of the factors of production—land, labor, and capital. They sell the use of these factors of production to firms, receiving rent, wages, and interest payments in return. Firms buy, and pay households for, the use of those factors of production in factor markets, represented to the right of center in the diagram. Most households derive the bulk of their income from wages earned by selling labor. Some households derive additional income from their indirect ownership of the physical capital used by firms, mainly in the form of stocks—shares in the ownership of a company—and bonds—loans to firms in the form of an IOU that pays interest. In other words, the income households receive from the factor markets includes profit distributed to company shareholders and the interest payments on any bonds that they hold. Finally, households receive rent from firms in exchange for the use of land or structures that the households own. So in factor markets, households receive income in the form of wages, profit, interest, and rent.
Page 108
Government transfers are payments that the government makes to individuals without expecting a good or service in return.
Disposable income, equal to income plus government transfers minus taxes, is the total amount of household income available to spend on consumption and to save.
Some households receive government transfers—payments that the government makes to individuals without expecting a good or service in return. Unemployment insurance payments are one example of a government transfer. Households spend most of their income on goods and services. However, in Figure 10.2 we see two reasons why the markets for goods and services don’t in fact absorb all of a household’s income. First, households don’t get to keep all the income they receive. They must pay part of their income to the government in the form of taxes, such as income taxes and sales taxes. The total income households have left after receiving government transfers and paying taxes is disposable income.
Private savings, equal to disposable income minus consumer spending, is disposable income that is not spent on consumption.
The banking, stock, and bond markets, which channel private savings and foreign lending into investment spending, government borrowing, and foreign borrowing, are known as the financial markets.
The second reason that the markets for goods and services do not absorb all household income is that many households set aside a portion of their income for private savings. These private savings go into financial markets where individuals, banks, and other institutions buy and sell stocks and bonds as well as make loans. As Figure 10.2 shows, the financial markets (on the far right of the circular-flow diagram) also receive funds from the rest of the world and provide funds to the government, to firms, and to the rest of the world.
Before going further, we can use the box representing households to illustrate an important general characteristic of the circular-flow diagram: the total sum of flows of money out of a given box is equal to the total sum of flows of money into that box. It’s simply a matter of accounting: what goes in must come out. So, for example, the total flow of money out of households—the sum of taxes paid, consumer spending, and private savings—must equal the total flow of money into households—the sum of wages, profit, interest, rent, and government transfers.
Government borrowing is the amount of funds borrowed by the government in the financial markets.
Government purchases of goods and services are total expenditures on goods and services by federal, state, and local governments.
Now let’s look at the other inhabitants in the circular-flow diagram, including the government and the rest of the world. The government returns a portion of the money it collects from taxes to households in the form of government transfers. However, it uses much of its tax revenue, plus additional funds borrowed in the financial markets through government borrowing, to buy goods and services. Government purchases of goods and services, the total of purchases made by federal, state, and local governments, includes everything from military spending on ammunition to your local public school’s spending on chalk, erasers, and teacher salaries.
Goods and services sold to other countries are exports. Goods and services purchased from other countries are imports.
The rest of the world participates in the U.S. economy in three ways. First, some of the goods and services produced in the United States are sold to residents of other countries. For example, more than half of America’s annual wheat and cotton crops are sold abroad. Goods and services sold to other countries are known as exports. Export sales lead to a flow of funds from the rest of the world into the United States to pay for them. Second, some of the goods and services purchased by residents of the United States are produced abroad. For example, many consumer goods are now made in China. Goods and services purchased from other countries are known as imports. Import purchases lead to a flow of funds out of the United States to pay for them. Third, foreigners can participate in U.S. financial markets. Foreign lending—lending by foreigners to borrowers in the United States and purchases by foreigners of shares of stock in American companies—generates a flow of funds into the United States from the rest of the world. Conversely, foreign borrowing—borrowing by foreigners from U.S. lenders and purchases by Americans of stock in foreign companies—leads to a flow of funds out of the United States to the rest of the world.

Supplies used in public schools, such as the chalk shown here, are among the goods and services purchased by the government.
Thinkstock/Comstock/Getty Images
Inventories are stocks of goods and raw materials held to facilitate business operations.
Investment spending is spending on new productive physical capital, such as machinery and structures, and on changes in inventories.
Notice that, like households, firms also buy goods and services in our economy. For example, an automobile company that is building a new factory will buy investment goods—machinery like stamping presses and welding robots—from companies that manufacture these items. It will also accumulate an inventory of finished cars in preparation for shipment to dealers. Inventories, then, are goods and raw materials that firms hold to facilitate their operations. The national accounts count this investment spending—spending on new productive physical capital, such as machinery and buildings, and on changes in inventories—as part of total spending on goods and services.
Page 109
You might ask why changes in inventories are included in investment spending—after all, finished cars aren’t used to produce more cars. Changes in inventories of finished goods are counted as investment spending because, like machinery, they change the ability of a firm to make future sales. So spending on additions to inventories is a form of investment spending by a firm. Conversely, a drawing-down of inventories is counted as a fall in investment spending because it leads to lower future sales. It’s also important to understand that investment spending includes spending on the construction of any structure, regardless of whether it is an assembly plant or a new house. Why include the construction of homes? Because, like a plant, a new house produces a future stream of output—housing services for its occupants.
Suppose we add up consumer spending on goods and services, investment spending, government purchases of goods and services, and the value of exports, then subtract the value of imports. This gives us a measure of the overall market value of the goods and services the economy produces. That measure has a name: it’s a country’s gross domestic product. But before we can formally define gross domestic product, or GDP, we have to examine an important distinction between classes of goods and services: the difference between final goods and services versus intermediate goods and services.
Gross Domestic Product
Final goods and services are goods and services sold to the final, or end, user.
Intermediate goods and services are goods and services bought from one firm by another firm to be used as inputs into the production of final goods and services.
Gross domestic product, or GDP, is the total value of all final goods and services produced in the economy during a given year.
The value-added approach to calculating GDP is to survey firms and add up their contributions to the value of final goods and services.
The expenditure approach to calculating GDP is to add up aggregate spending on domestically produced final goods and services in the economy—the sum of consumer spending, investment spending, government purchases of goods and services, and exports minus imports.
Aggregate spending—the total spending on domestically produced final goods and services in the economy—is the sum of consumer spending, investment spending, government purchases of goods and services, and exports minus imports.
The income approach to calculating GDP is to add up the total factor income earned by households from firms in the economy, including rent, wages, interest, and profit.
A consumer’s purchase of a new car from a dealer is one example of a sale of final goods and services: goods and services sold to the final, or end, user. But an automobile manufacturer’s purchase of steel from a steel foundry or glass from a glassmaker is an example of a sale of intermediate goods and services: goods and services that are inputs into the production of final goods and services. In the case of intermediate goods and services, the purchaser—another firm—is not the final user.
Gross domestic product, or GDP, is the total value of all final goods and services produced in an economy during a given period, usually a year. In 2013 the GDP of the United States was $16,803 billion, or about $53,086 per person.
There are three approaches to the calculation of GDP. The value-added approach is to survey firms and add up their contributions to the value of final goods and services. The expenditure approach is to add up aggregate spending on domestically produced final goods and services in the economy—the sum of consumer spending, investment spending, government purchases of goods and services, and exports minus imports. The income approach is to add up the total factor income earned by households from firms in the economy, including rent, wages, interest, and profit.
Government statisticians use all three methods. To illustrate how they work, we will consider a hypothetical economy, shown in Figure 10.3. This economy consists of three firms—American Motors, Inc., which produces one car per year; American Steel, Inc., which produces the steel that goes into the car; and American Ore, Inc., which mines the iron ore that goes into the steel. GDP in this economy is $21,500, the value of the one car per year the economy produces. Let’s look at how the three different methods of calculating GDP yield the same result.
| Figure 10.3 | Calculating GDP |
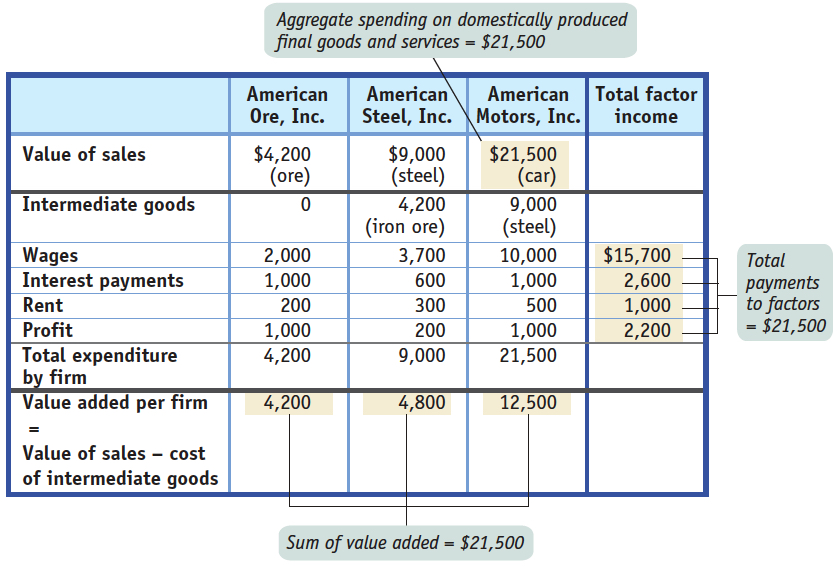
Figure 10.3: Calculating GDPIn this hypothetical economy consisting of three firms, GDP can be calculated in three different ways: measuring GDP as the value of production of final goods and services by summing each firm’s value added; measuring GDP as aggregate spending on domestically produced final goods and services; and measuring GDP as factor income earned by households from firms in the economy.
The Value-Added Approach The first method for calculating GDP is to add up the value of all the final goods and services produced in the economy—a calculation that excludes the value of intermediate goods and services. Why are intermediate goods and services excluded? After all, don’t they represent a very large and valuable portion of the economy?
Page 110
AP® Exam Tip
The trick to measuring GDP is to avoid double-counting. Each approach to calculating GDP includes a way to avoid counting the value of inputs twice—once at the production stage and again in the value of the final product. Likewise, the value of used goods should not be counted because their value was part of GDP when the goods were new.
To understand why only final goods and services are included in GDP, look at the simplified economy described in Figure 10.3. Should we measure the GDP of this economy by adding up the total sales of the iron ore producer, the steel producer, and the auto producer? If we did, we would in effect be counting the value of the steel twice—once when it is sold by the steel plant to the auto plant and again when the steel auto body is sold to a consumer as a finished car. And we would be counting the value of the iron ore three times—once when it is mined and sold to the steel company, a second time when it is made into steel and sold to the auto producer, and a third time when the steel is made into a car and sold to the consumer. So counting the full value of each producer’s sales would cause us to count the same items several times and artificially inflate the calculation of GDP.
The value added of a producer is the value of its sales minus the value of its purchases of inputs.
In Figure 10.3, the total value of all sales, intermediate and final, is $34,700: $21,500 from the sale of the car, plus $9,000 from the sale of the steel, plus $4,200 from the sale of the iron ore. Yet we know that GDP—the total value of all final goods and services in a given year—is only $21,500. To avoid double-counting, we count only each producer’s value added in the calculation of GDP: the difference between the value of its sales and the value of the inputs it purchases from other businesses. That is, at each stage of the production process we subtract the cost of inputs—the intermediate goods—at that stage. In this case, the value added of the auto producer is the dollar value of the cars it manufactures minus the cost of the steel it buys, or $12,500. The value added of the steel producer is the dollar value of the steel it produces minus the cost of the ore it buys, or $4,800. Only the ore producer, who we have assumed doesn’t buy any inputs, has value added equal to its total sales, $4,200. The sum of the three producers’ value added is $12,500 + $4,800 + $4,200 = $21,500, equal to GDP.
The Expenditure Approach Another way to calculate GDP is by adding up aggregate spending on domestically produced final goods and services. That is, GDP can be measured by the flow of funds into firms. Like the method that estimates GDP as the value of domestic production of final goods and services, this measurement must be carried out in a way that avoids double-counting. In terms of our steel and auto example, we don’t want to count both consumer spending on a car (represented in Figure 10.3 by the sales price of the car) and the auto producer’s spending on steel (represented in Figure 10.3 by the price of a car’s worth of steel). If we counted both, we would be counting the steel embodied in the car twice. We solve this problem by counting only the value of sales to final buyers, such as consumers, firms that purchase investment goods, the government, or foreign buyers. In other words, in order to avoid the double-counting of spending, we omit sales of inputs from one business to another when estimating GDP using spending data. You can see from Figure 10.3 that aggregate spending on final goods and services—the finished car—is $21,500.
Page 111
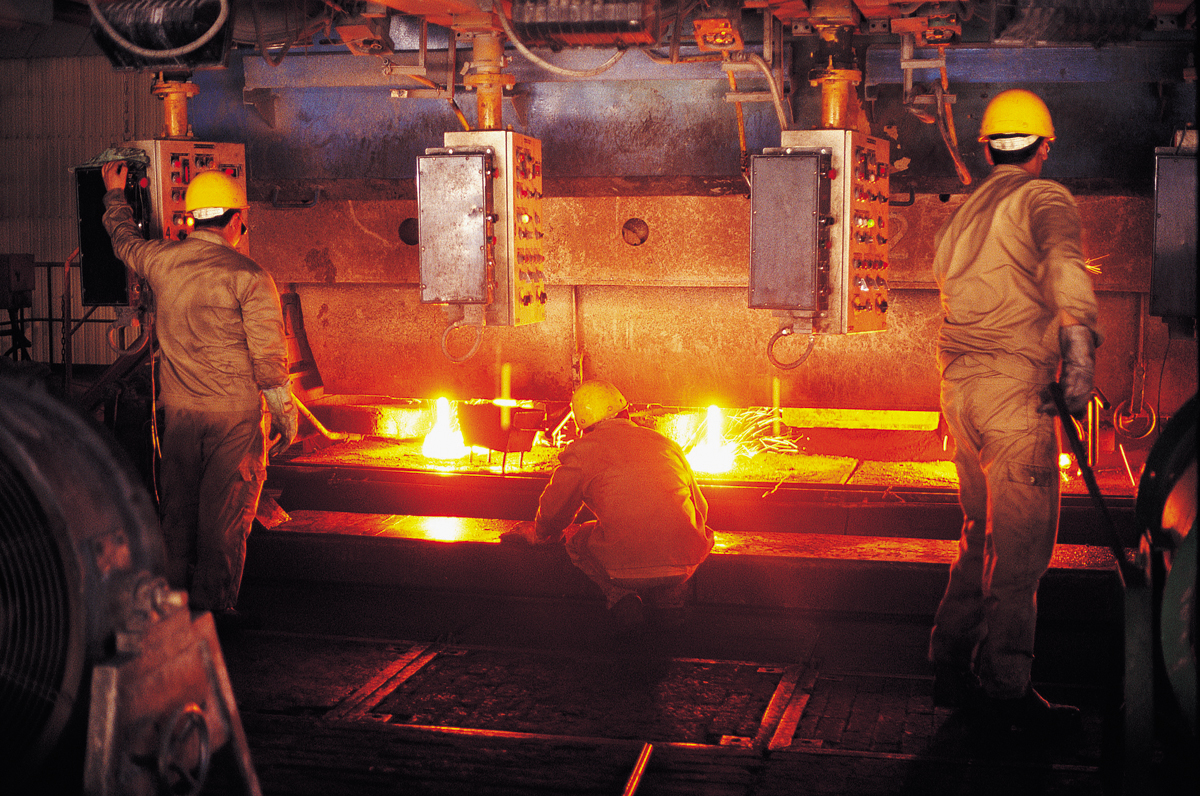
Steel is an intermediate good because it is sold to other product manufacturers like automakers or refrigerator makers, and rarely to the final consumer.
Digitalvision
As we’ve already pointed out, the national accounts do include investment spending by firms as a part of final spending. That is, an auto company’s purchase of steel to make a car isn’t considered a part of final spending, but the company’s purchase of new machinery for its factory is considered a part of final spending. What’s the difference? Steel is an input that is used up in production; machinery will last for a number of years. Since purchases of capital goods that will last for a considerable time aren’t closely tied to current production, the national accounts consider such purchases a form of final sales.
What types of spending make up GDP? Look again at the markets for goods and services in Figure 10.2, and you will see that one source of sales revenue for firms is consumer spending. Let’s denote consumer spending with the symbol C. Figure 10.2 shows three other components of sales: sales of investment goods to other businesses, or investment spending, which we will denote by I; government purchases of goods and services, which we will denote by G; and sales to foreigners—that is, exports—which we will denote by X.
In reality, not all of this final spending goes toward domestically produced goods and services. We must take account of spending on imports, which we will denote by IM. Income spent on imports is income not spent on domestic goods and services—it is income that has “leaked” across national borders. So to calculate domestic production using spending data, we must subtract spending on imports. Putting this all together gives us the following equation, which breaks GDP down by the four sources of aggregate spending:
(10-1) GDP = C + I + G + X − IM
Net exports are the difference between the value of exports and the value of imports (X − IM).
Note that the value of X − IM—the difference between the value of exports and the value of imports—is known as net exports. We’ll be seeing a lot of Equation 10-1 in later modules!
The Income Approach A final way to calculate GDP is to add up all the income earned by factors of production in the economy—the wages earned by labor; the interest earned by those who lend their savings to firms and the government; the rent earned by those who lease their land or structures to firms; and the profit earned by the shareholders, the owners of the firms’ physical capital. This is a valid measure because the money firms earn by selling goods and services must go somewhere; whatever isn’t paid as wages, interest, or rent is profit. And part of profit is paid out to shareholders as dividends.
Figure 10.3 shows how this calculation works for our simplified economy. The shaded column at the far right shows the total wages, interest, and rent paid by all these firms, as well as their total profit. Adding up all of these yields a total factor income of $21,500—again, equal to GDP.
We won’t emphasize the income approach as much as the other two approaches to calculating GDP. It’s important to keep in mind, however, that all the money spent on domestically produced goods and services generates factor income to households—that is, there really is a circular flow.
Page 112
The Components of GDP Now that we know how GDP is calculated in principle, let’s see what it looks like in practice.
Figure 10.4 shows the first two methods of calculating GDP side by side. The height of each bar above the horizontal axis represents the GDP of the U.S. economy in 2013: $16,803 billion. Each bar is divided to show the breakdown of that total in terms of where the value was added and how the money was spent.
| Figure 10.4 | U.S. GDP in 2013: Two Methods of Calculating GDP |
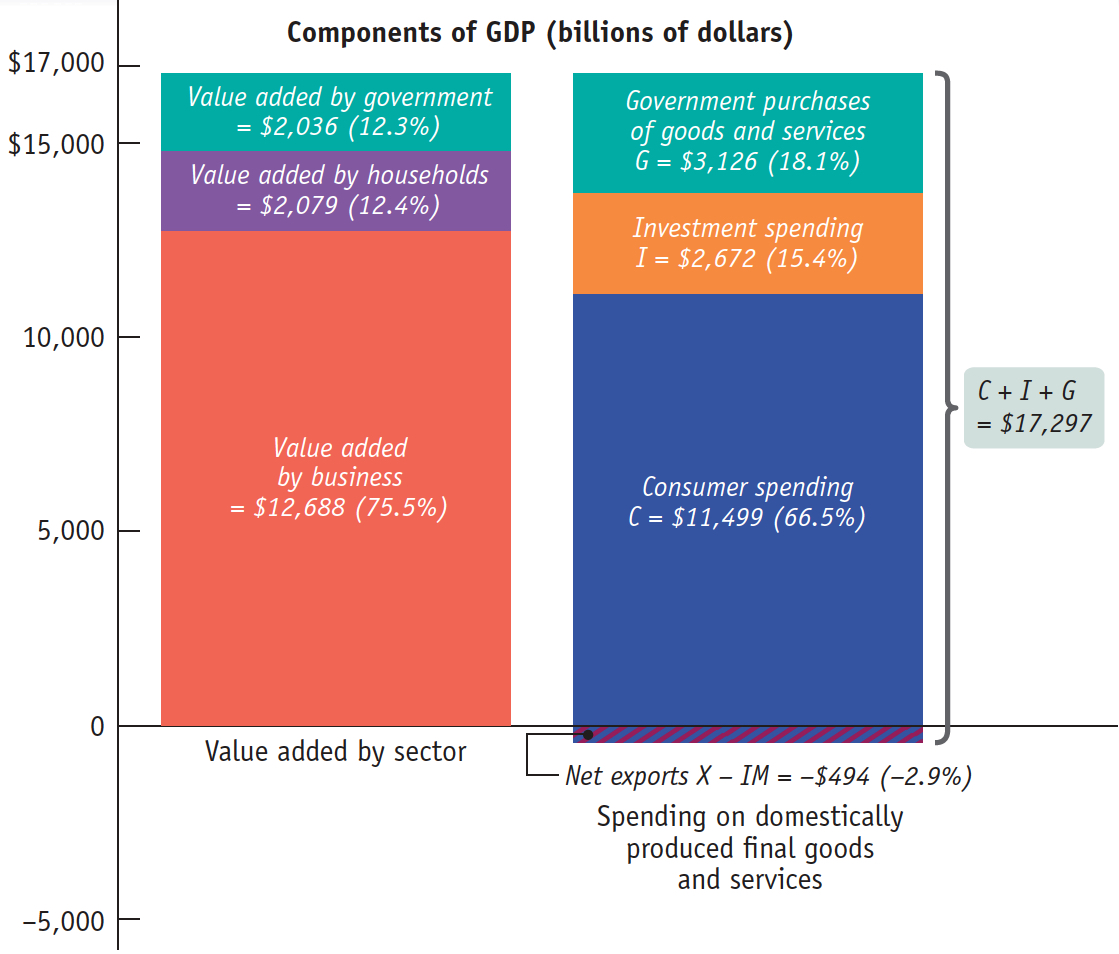
Figure 10.4: U.S. GDP in 2013: Two Methods of Calculating GDPThe two bars show two equivalent ways of calculating GDP. The height of each bar above the horizontal axis represents $16,803 billion, U.S. GDP in 2013. The left bar shows the breakdown of GDP according to the value added of each sector of the economy. The right bar shows the breakdown of GDP according to the four types of aggregate spending: C + I + G + X − IM. The right bar has a total height of $16,803 billion + $494 billion = $17,297 billion. The $494 billion, shown as the area extending below the horizontal axis, is the amount of total spending absorbed by net imports (negative net exports) in 2013.
Source: Bureau of Economic Analysis.
In the left bar in Figure 10.4, we see the breakdown of GDP by value added according to sector, the first method of calculating GDP. Of the $16,803 billion, $12,688 billion consisted of value added by businesses. Another $1,830 billion of value added was contributed by households and institutions. Finally, $2,036 billion consisted of value added by government, in the form of military, education, and other government services.
The right bar in Figure 10.4 corresponds to the second method of calculating GDP, showing the breakdown by the four types of aggregate spending. The total height of the right bar is greater than the total height of the left bar, a difference of $494 billion (which, as you can see, extends below the horizontal axis). That’s because the total height of the right bar represents total spending in the economy, spending on both domestically produced and foreign-produced—imported—final goods and services. Within the bar, consumer spending (C), which is 66.5% of GDP, dominates the picture. But some of that spending was absorbed by foreign-produced goods and services. In 2013, the value of net exports, the difference between the value of exports and the value of imports (X − IM in Equation 10-1), was negative—the United States was a net importer of foreign goods and services. The 2013 value of X − IM was −$494 billion, or −2.9% of GDP. Thus, a portion of the right bar extends below the horizontal axis by $494 billion to represent the amount of total spending that was absorbed by net imports and so did not lead to higher U.S. GDP. Investment spending (I) constituted 15.4% of GDP; government purchases of goods and services (G) constituted 18.1% of GDP.
Page 113
GDP: What’s In and What’s Out? It’s easy to confuse what is included and what isn’t included in GDP. So let’s stop here and make sure the distinction is clear. Don’t confuse investment spending with spending on inputs. Investment spending—spending on productive physical capital, the construction of structures (residential as well as commercial), and changes to inventories—is included in GDP. But spending on inputs is not. Why the difference? Recall the distinction between resources that are used up and those that are not used up in production. An input, like steel, is used up in production. A metal-stamping machine, an investment good, is not. It will last for many years and will be used repeatedly to make many cars. Since spending on productive physical capital—investment goods—and the construction of structures is not directly tied to current output, economists consider such spending to be spending on final goods. Spending on changes to inventories is considered a part of investment spending so it is also included in GDP. Why? Because, like a machine, additional inventory is an investment in future sales. And when a good is released for sale from inventories, its value is subtracted from the value of inventories and so from GDP. Used goods are not included in GDP because, as with inputs, to include them would be to double-count: counting them once when sold as new and again when sold as used.

The United States is a net importer of goods and services, such as these toys made on a production line in China.
Photo by Feng Li/Getty Images
Also, financial assets such as stocks and bonds are not included in GDP because they don’t represent either the production or the sale of final goods and services. Rather, a bond represents a promise to repay with interest, and a stock represents a proof of ownership. And for obvious reasons, foreign-produced goods and services are not included in calculations of gross domestic product.
Here is a summary of what’s included and not included in GDP:
Domestically produced final goods and services, including capital goods, new construction of structures, and changes to inventories
Intermediate goods and services
-
-
Financial assets such as stocks and bonds
Foreign-produced goods and services
AP® Exam Tip
Use this mnemonic to help you remember what isn't counted in GDP: IF IF U
Intermediate goods and services
Financial assets and transfer payments
Inputs used up in production
Foreign-produced goods and services