Real GDP: A Measure of Aggregate Output
At the beginning of this section we described how China passed Japan as the world’s second-
Creating the National Accounts
Creating the National Accounts
The national accounts, like modern macroeconomics, owe their creation to the Great Depression. As the economy plunged into depression, government officials found their ability to respond crippled not only by the lack of adequate economic theories but also by the lack of adequate information. All they had were scattered statistics: railroad freight car loadings, stock prices, and incomplete indexes of industrial production. They could only guess at what was happening to the economy as a whole.
In response to this perceived lack of information, the Department of Commerce commissioned Simon Kuznets, a young Russian-
Kuznets’s initial estimates fell short of the full modern set of accounts because they focused on income rather than production. The push to complete the national accounts came during World War II, when policy makers were in even more need of comprehensive measures of the economy’s performance. The federal government began issuing estimates of gross domestic product and gross national product in 1942.
In January 2000, in its publication Survey of Current Business, the Department of Commerce ran an article titled “GDP: One of the Great Inventions of the 20th Century.” This may seem a bit over the top, but national income accounting, invented in the United States, has since become a tool of economic analysis and policy making around the world.
The moral of this story is that the commonly cited GDP number is an interesting and useful statistic, one that provides a good way to compare the size of different economies, but it’s not a good measure of the economy’s growth over time. GDP can grow because the economy grows, but it can also grow simply because of inflation. Even if an economy’s output doesn’t change, GDP will go up if the prices of the goods and services the economy produces increase. Likewise, GDP can fall either because the economy is producing less or because prices have fallen.
Aggregate output is the total quantity of final goods and services produced within an economy.
To measure the economy’s growth with accuracy, we need a measure of aggregate output: the total quantity of final goods and services the economy produces. As we noted above, the measure that is used for this purpose is known as real GDP. By tracking real GDP over time, we avoid the problem of changes in prices distorting the value of changes in production over time. Let’s look first at how real GDP is calculated and then at what it means.
Calculating Real GDP
AP® Exam Tip
Aggregate output is another name for GDP. You may see (or hear) it referred to as output, economic output, or aggregate output.
To understand how real GDP is calculated, imagine an economy in which only two goods, apples and oranges, are produced and in which both goods are sold only to final consumers. The outputs and prices of the two fruits for two consecutive years are shown in Table 11.1.
Table 11.1Calculating GDP and Real GDP in a Simple Economy
| Year 1 | Year 2 | |
| Quantity of apples (billions) | 2,000 | 2,200 |
| Price of an apple | $0.25 | $0.30 |
| Quantity of oranges (billions) | 1,000 | 1,200 |
| Price of an orange | $0.50 | $0.70 |
| GDP (billions of dollars) | $1,000 | $1,500 |
| Real GDP (billions of year 1 dollars) | $1,000 | $1,150 |
The first thing we can say about these data is that the value of sales increased from year 1 to year 2. In the first year, the total value of sales was (2,000 billion × $0.25) + (1,000 billion × $0.50) = $1,000 billion; in the second, it was (2,200 billion × $0.30) + (1,200 billion × $0.70) = $1,500 billion, which is 50% larger. But it is also clear from the table that this increase in the dollar value of GDP overstates the real growth in the economy. Although the quantities of both apples and oranges increased, the prices of both apples and oranges also rose. So part of the 50% increase in the dollar value of GDP simply reflects higher prices, not increased production.
To estimate the true increase in aggregate output produced, we have to ask the following question: How much would GDP have gone up if prices had not changed? To answer this question, we need to find the value of output in year 2 expressed in year 1 prices. In year 1, the price of apples was $0.25 each and the price of oranges $0.50 each. So year 2 output at year 1 prices is (2,200 billion × $0.25) + (1,200 billion × $0.50) = $1,150 billion. Since output in year 1 at year 1 prices was $1,000 billion, GDP measured in year 1 prices rose 15%—from $1,000 billion to $1,150 billion.

Real GDP is the total value of all final goods and services produced in the economy during a given year, calculated using the prices of a selected base year in order to remove the effects of price changes.
Nominal GDP is the total value of all final goods and services produced in the economy during a given year, calculated with the prices current in the year in which the output is produced.
Now we can define real GDP: it is the total value of all final goods and services produced in the economy during a year, calculated as if prices had stayed constant at the level of some given base year in order to remove the effects of price changes. A real GDP number always comes with information about what the base year is. A GDP number that has not been adjusted for changes in prices is calculated using the prices in the year in which the output is produced. Economists call this measure nominal GDP, or GDP at current prices. If we had used nominal GDP to measure the change in output from year 1 to year 2 in our apples and oranges example, we would have overstated the true growth in output: we would have claimed it to be 50%, when in fact it was only 15%. By comparing output in the two years using a common set of prices—
Table 11.2 shows a real-
Table 11.2Nominal versus Real GDP in 2000, 2005, and 2013
| Nominal GDP (billions of current dollars) | Real GDP (billions of 2005 dollars) | |
| 2000 | $9,951.5 | $11,286 |
| 2005 | 12,683 | 12,638 |
| 2013 | 16,803 | 14,504 |
Source: Bureau of Economic Analysis.
Chain-
You might have noticed that there is an alternative way to calculate real GDP using the data in Table 11.1. Why not measure it using the prices of year 2 rather than year 1 as the base-
What Real GDP Doesn’t Measure
GDP is a measure of a country’s aggregate output. Other things equal, a country with a larger population will have higher GDP simply because there are more people working. So if we want to compare GDP across countries but want to eliminate the effect of differences in population size, we use the measure GDP per capita—GDP divided by the size of the population, equivalent to the average GDP per person. Correspondingly, real GDP per capita is the average real GDP per person.
GDP per capita is GDP divided by the size of the population; it is equivalent to the average GDP per person.
Real GDP per capita can be a useful measure in some circumstances, such as in a comparison of labor productivity between two countries. However, despite the fact that it is a rough measure of the average real output per person, real GDP per capita has well-
Real GDP does not include many of the things that contribute to happiness, such as leisure time, volunteerism, housework, and natural beauty. And real GDP increases with expenditures on some things that make people unhappy, including disease, divorce, crime, and natural disasters.

Real GDP per capita is a measure of an economy’s average aggregate output per person—
Miracle in Venezuela?
Miracle in Venezuela?
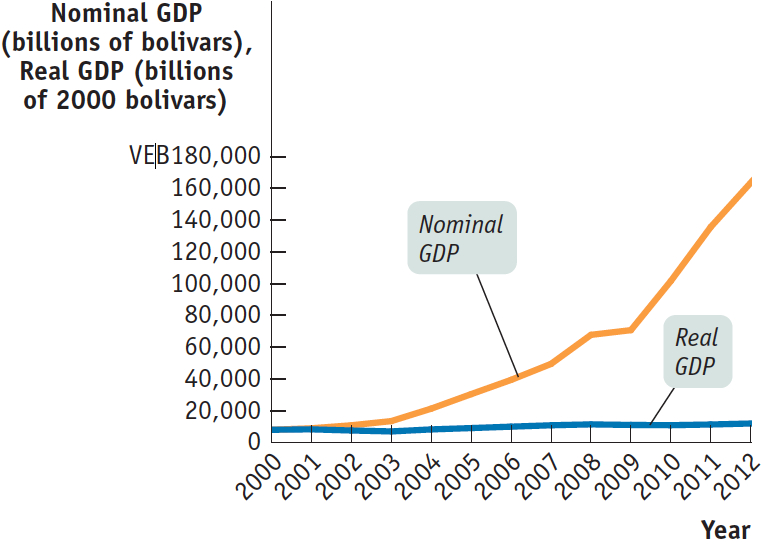
The South American nation of Venezuela has a distinction that may surprise you: in recent years, it has had one of the world’s fastest-
So is Venezuela experiencing an economic miracle? No, it’s just suffering from unusually high inflation. The figure shows Venezuela’s nominal and real GDP from 2000 to 2012, with real GDP measured in 2000 prices. Real GDP did grow over the period, but at an annual rate of only 2.0%. That’s about the same as the U.S. growth rate over the same period and far short of China’s 10% growth.Source: World Bank.