The Unemployment Rate
The economy—
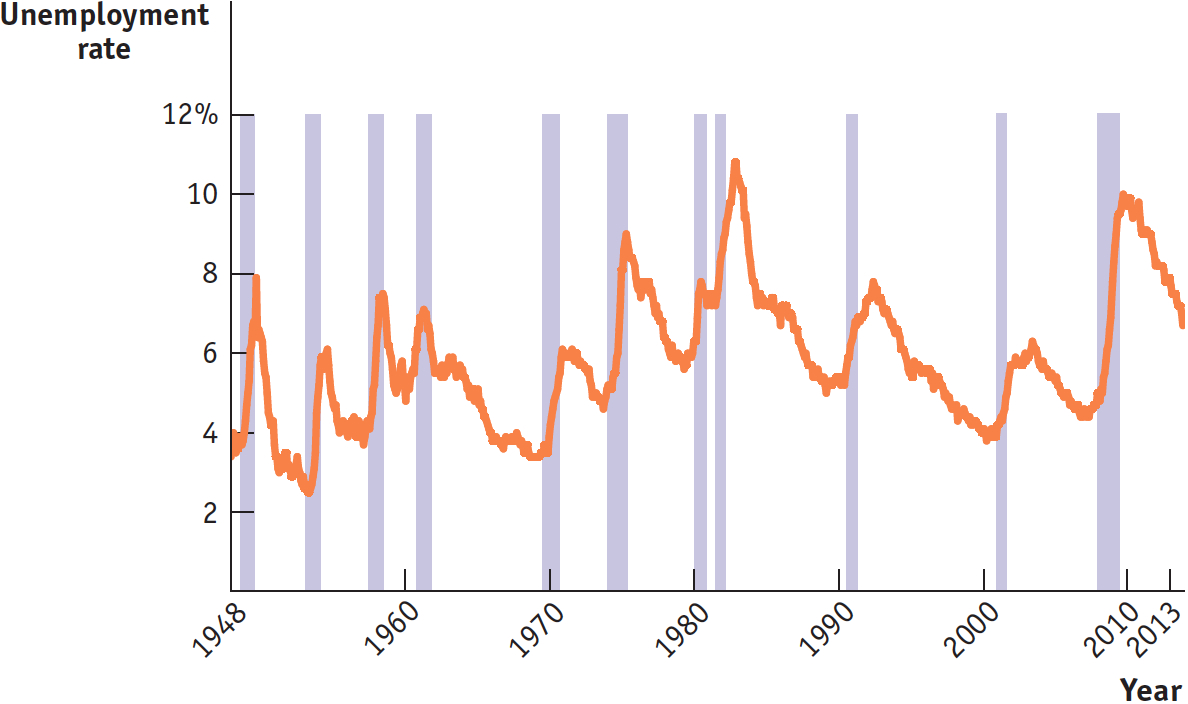
| Figure 12.1 | The U.S. Unemployment Rate, 1948– |
Defining and Measuring Unemployment
Employed people are currently holding a job in the economy, either full time or part time.
It’s easy to define employment: you’re employed if and only if you have a job.
Unemployment, however, is a more subtle concept. Just because a person isn’t working doesn’t mean that we consider that person unemployed. For example, in April 2014 there were 38 million retired workers in the United States receiving Social Security checks. Most of them were probably happy that they were no longer working, so we wouldn’t consider someone who has settled into a comfortable, well-
Unemployed people are actively looking for work but aren’t currently employed.
The U.S. Census Bureau, the federal agency that collects data on unemployment, considers the unemployed to be those who are “jobless, looking for jobs, and available for work.” Retired people don’t count because they aren’t looking for jobs; the disabled don’t count because they aren’t available for work. More specifically, an individual is considered unemployed if he or she doesn’t currently have a job and has been actively seeking a job during the past four weeks. So the unemployed are people who are actively looking for work but aren’t currently employed.
The labor force is equal to the sum of the employed and the unemployed.
The labor force participation rate is the percentage of the population aged 16 or older that is in the labor force.
A country’s labor force is the sum of the employed and the unemployed—

AP® Exam Tip
A formula sheet is not provided during the AP® exam. You will need to remember these formulas to calculate the size of the labor force and the unemployment rate.
The unemployment rate is the percentage of the total number of people in the labor force who are unemployed.
The unemployment rate, defined as the percentage of the total number of people in the labor force who are unemployed, is calculated as follows:

To estimate the numbers that go into calculating the unemployment rate, the U.S. Census Bureau carries out a monthly survey called the Current Population Survey, which involves interviewing a random sample of 60,000 American families. People are asked whether they are currently employed. If they are not employed, they are asked whether they have been looking for a job during the past four weeks. The results are then scaled up, using estimates of the total population, to estimate the total number of employed and unemployed Americans.
The Significance of the Unemployment Rate
In general, the unemployment rate is a good indicator of how easy or difficult it is to find a job given the current state of the economy. When the unemployment rate is low, nearly everyone who wants a job can find one. In 2000, when the unemployment rate averaged 4%, jobs were so abundant that employers spoke of a “mirror test” for getting a job: if you were breathing (therefore, your breath would fog a mirror), you could find work. By contrast, in 2009, the unemployment rate in 17 states rose to over 10% (over 15% in Michigan), with many highly qualified workers having lost their jobs and having a hard time finding new ones. Although the unemployment rate is a good indicator of current labor market conditions, it is not a perfect measure.
How the Unemployment Rate Can Overstate the True Level of Unemployment If you are searching for work, it’s normal to take at least a few weeks to find a suitable job. Yet a worker who is quite confident of finding a job, but has not yet accepted a position, is counted as unemployed. As a consequence, the unemployment rate never falls to zero, even in boom times when jobs are plentiful. Even in the buoyant labor market of 2000, when it was easy to find work, the unemployment rate was still 4%. Later, we’ll discuss in greater depth the reasons that measured unemployment persists even when jobs are abundant.

Discouraged workers are nonworking people who are capable of working but have given up looking for a job due to the state of the job market.
How the Unemployment Rate Can Understate the True Level of Unemployment Frequently, some of the people who would like to work but aren’t working still don’t get counted as unemployed. In particular, an individual who has given up looking for a job for the time being because there are no jobs available isn’t counted as unemployed because he or she has not been searching for a job during the previous four weeks. Individuals who want to work but aren’t currently searching because they see little prospect of finding a job given the state of the job market are known as discouraged workers. Because it does not count discouraged workers, the measured unemployment rate may understate the percentage of people who want to work but are unable to find jobs.
Marginally attached workers would like to be employed and have looked for a job in the recent past but are not currently looking for work.
Discouraged workers are part of a larger group known as marginally attached workers. These are people who say they would like to have a job and have looked for work in the recent past but are not currently looking for work. The difference between discouraged workers and other marginally attached workers is that the other marginally attached workers ended their job search for a reason other than a belief that no job was available for them. For example, they may have gone back to school or become disabled. Marginally attached workers are also not included when calculating the unemployment rate.
The underemployed are workers who would like to work more hours or who are overqualified for their jobs.
Finally, another category of workers who are frustrated in their ability to find work but aren’t counted as unemployed are the underemployed: workers who would like to work more hours or who are overqualified for their jobs. For example, some part-
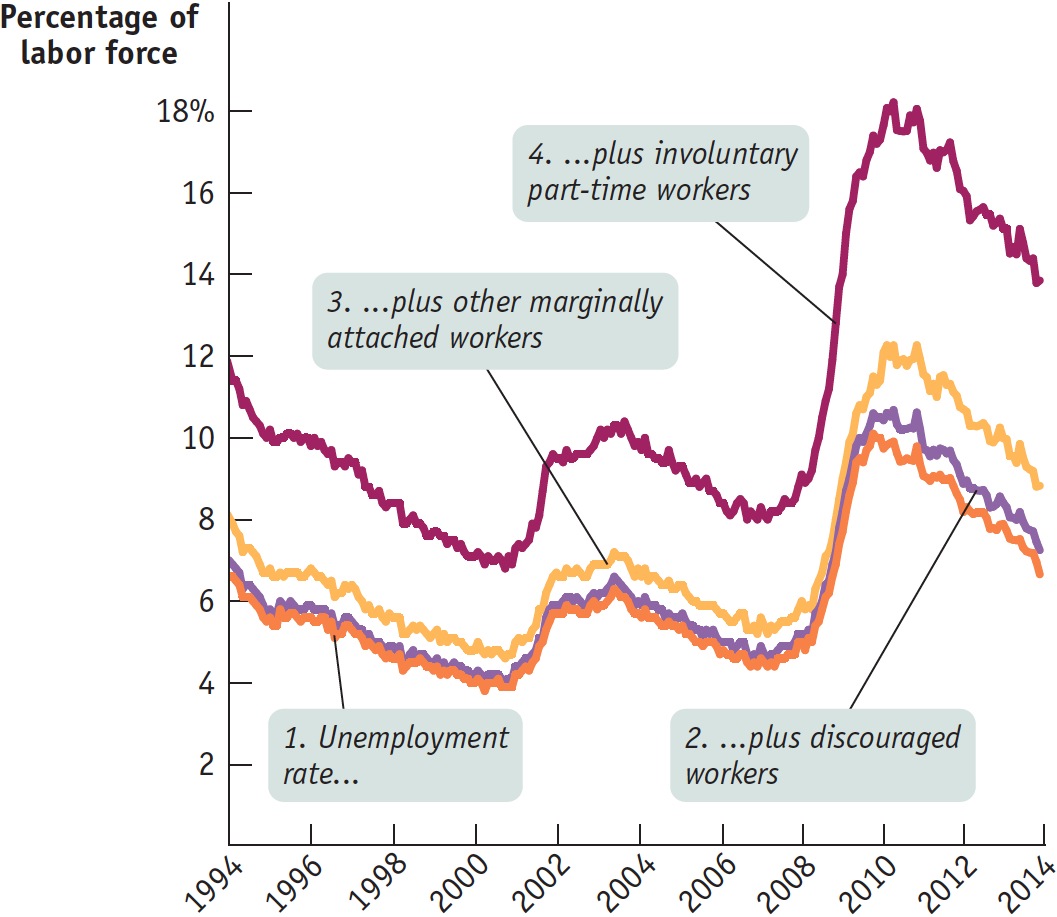
The Bureau of Labor Statistics is the federal agency that calculates the official unemployment rate. It also calculates broader “measures of labor underutilization” that include the three categories of frustrated workers. Figure 12.2 shows what happens to the measured unemployment rate once marginally attached workers (including discouraged workers) and the underemployed are counted. The broadest measure of unemployment and underemployment, known as U6, is the sum of these three measures plus the unemployed; it is substantially higher than the rate usually quoted by the news media. But U6 and the unemployment rate move very much in parallel, so changes in the unemployment rate remain a good guide to what’s happening in the overall labor market.
| Figure 12.2 | Alternative Measures of Unemployment, 1994– |
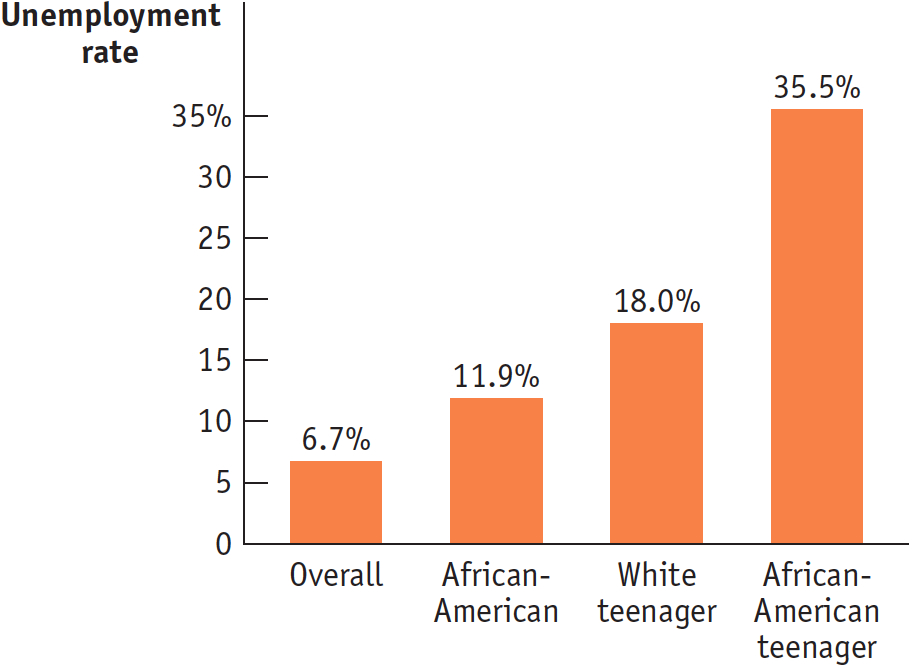
Finally, it’s important to realize that the unemployment rate varies greatly among demographic groups. Other things equal, jobs are generally easier to find for more experienced workers and for workers during their “prime” working years, from ages 25 to 54. For younger workers, as well as workers nearing retirement age, jobs are typically harder to find. Figure 12.3 shows unemployment rates for different groups in December 2013, when the overall unemployment rate of 6.7% was low by historical standards. As you can see, in December 2013 the unemployment rate for African-
| Figure 12.3 | Unemployment Rates of Different Groups, 2013 |
Although the unemployment rate is not an exact, literal measure of the percentage of people unable to find jobs, it is a good indicator of overall labor market conditions. The ups and downs of the unemployment rate closely reflect economic changes that have a significant impact on people’s lives. Let’s turn now to the causes of these fluctuations.
Growth and Unemployment
Compared to Figure 12.1, Figure 12.4 shows the U.S. unemployment rate over a somewhat shorter period, the 33 years from 1980 to 2013. The shaded bars represent periods of recession. As you can see, during every recession, without exception, the unemployment rate rose. The recession of 1981–
| Figure 12.4 | Unemployment and Recessions, 1980– |
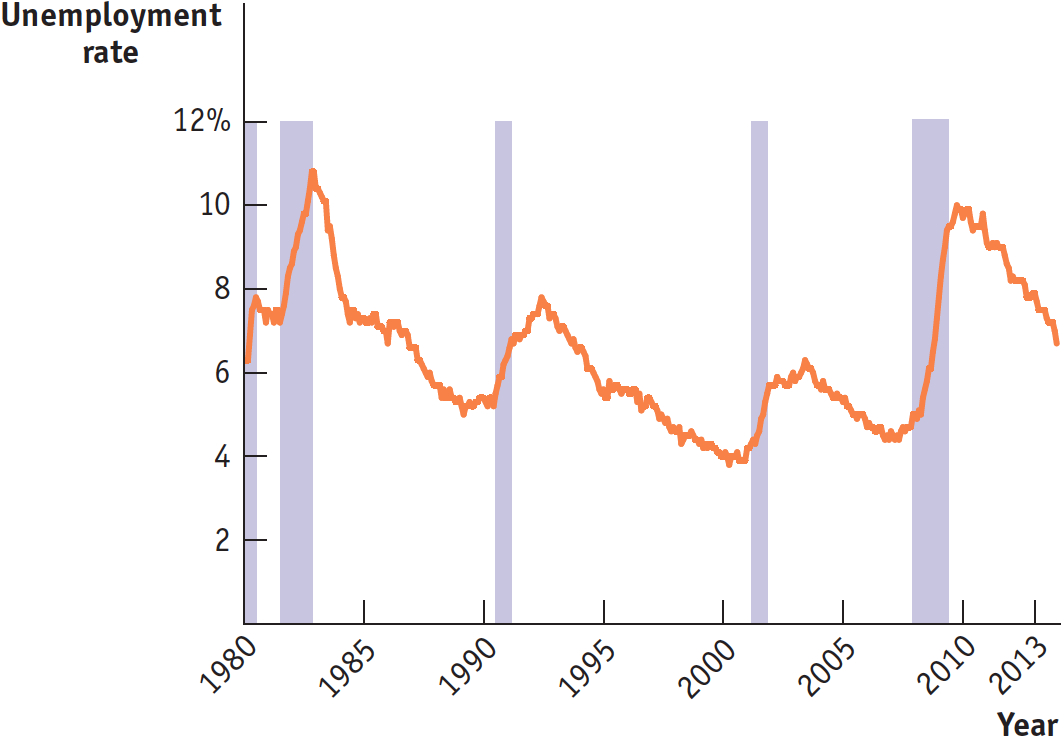
Correspondingly, during periods of economic expansion the unemployment rate usually falls. The long economic expansion of the 1990s eventually brought the unemployment rate below 4%. However, it’s important to recognize that economic expansions aren’t always periods of falling unemployment. Look at the periods immediately following two recent recessions, those of 1990–
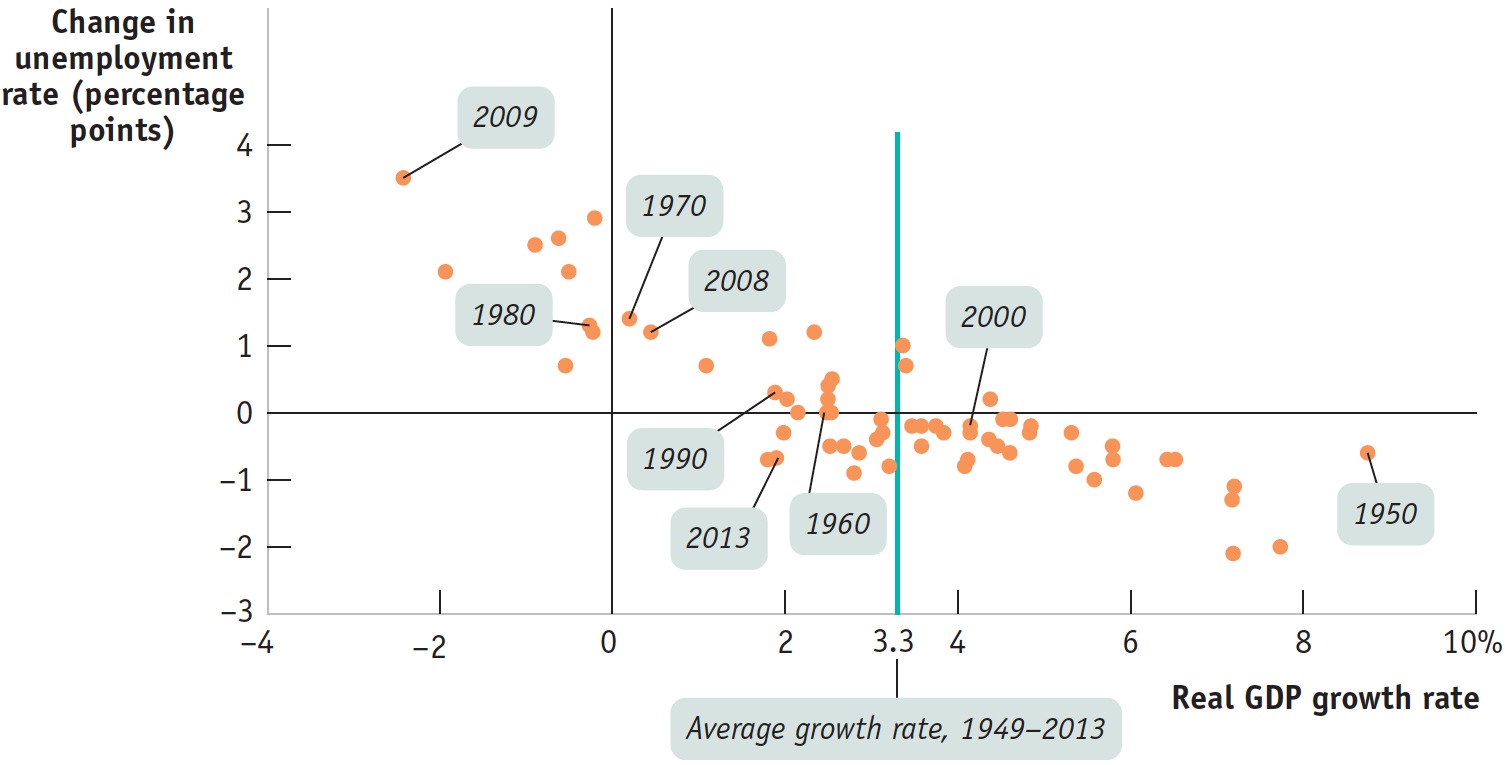
Figure 12.5 is a scatter diagram showing U.S. data for the period from 1949 to 2013.The horizontal axis measures the annual rate of growth in real GDP—
| Figure 12.5 | Growth and Changes in Unemployment, 1949– |
AP® Exam Tip
Unemployment always rises during recessions and usually falls during expansions. If a question indicates that real GDP is falling and asks about the effect on unemployment, you can conclude that it is rising.
The downward trend of the scatter points in Figure 12.5 shows that there is a generally strong negative relationship between growth in the economy and the rate of unemployment. Years of high growth in real GDP were also years in which the unemployment rate fell, and years of low or negative growth in real GDP were years in which the unemployment rate rose. The green vertical line in Figure 12.5 at the value of 3.3% indicates the average growth rate of real GDP over the period from 1949 to 2013. Points lying to the right of the vertical line are years of above-
Failure to Launch
Failure to Launch
In March 2010, when the U.S. job situation was near its worst, the Harvard Law Record published a brief note titled “Unemployed law student will work for $160K plus benefits.” In a self-
The answer, of course, is that it wasn’t about the résumé—it was about the economy. Times of high unemployment are especially hard on new graduates, who often find it hard to get any kind of full-
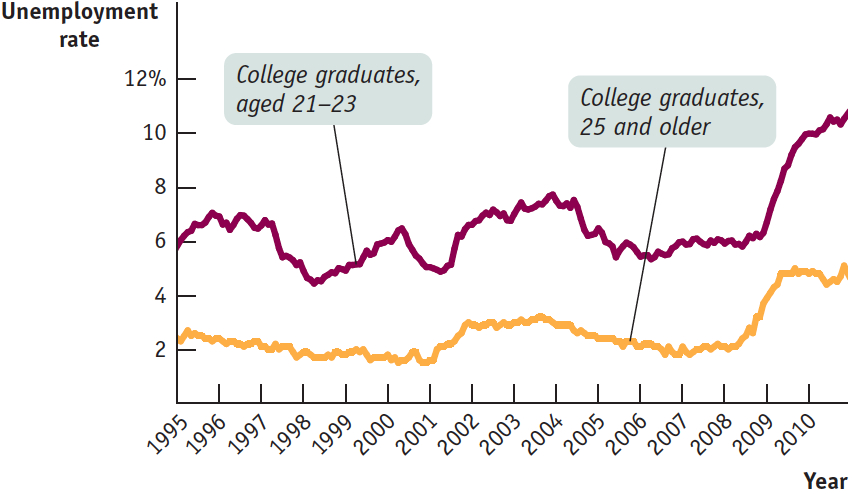
Although the overall unemployment rate for college graduates 25 and older, even at its peak, was only about 5%, unemployment among recent graduates aged 21–
A year later, the situation was starting to improve, but slowly: in December 2010, 74% of recent graduates had full-