Tackle the Test: Free-Response Questions
Question
Draw a correctly labeled graph showing aggregate demand.
On your graph from part a, illustrate an increase in aggregate demand.
List the four factors that shift aggregate demand.
Describe a change in each determinant of aggregate demand that would lead to the shift you illustrated in part b.
Rubric for FRQ 1 (12 points)
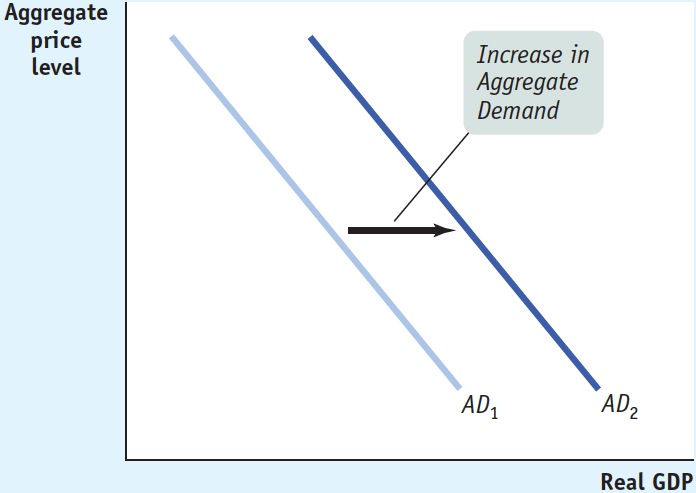
1 point: Vertical axis labeled “Aggregate price level” (or “Price level”)
1 point: Horizontal axis labeled “Real GDP”
1 point: Downward-
sloping curve labeled “AD” (or “AD1”) 1 point: AD curve shifted to the right
1 point: Expectations
1 point: Wealth
1 point: Size of existing stock of physical capital
1 point: Government policies
1 point: Consumers/Producers more confident
1 point: Increase in wealth
1 point: Lower existing stock of physical capital
1 point: An increase in government spending or in the money supply
Question
Identify the two effects that cause the aggregate demand curve to have a downward slope. Explain each. (4 points)
Rubric for FRQ 2 (4 points)
1 point: The wealth effect
1 point: The interest rate effect
1 point: The wealth effect : When the price level increases, the purchasing power of money decreases, causing consumers to scale back on spending. Because consumer spending is a component of aggregate demand, increases in the aggregate price level lead to decreases in the quantity of aggregate output demanded. The opposite is true for decreases in the price level. This negative relationship between the price level and the quantity of aggregate output demanded results in a downward-sloping aggregate demand curve.
1 point: The interest rate effect : Increases in the aggregate price level cause people to want to hold more money, which increases the demand for money and drives up interest rates. Higher interest rates reduce investment spending because it costs more to borrow money. Thus, a rise in the price level leads to less investment spending, which is a component of aggregate demand, and causes the quantity of aggregate output demanded to decrease (and vice versa). The result is a downward-sloping aggregate demand curve.