Tackle the Test: Free-Response Questions
Question
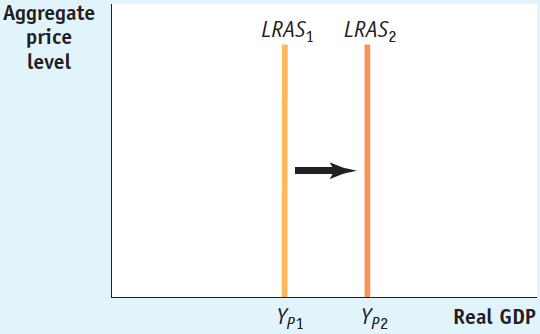
Draw a correctly labeled graph illustrating a long-
run aggregate supply curve. On your graph from part a, label potential output.
On your graph from part a, illustrate an increase in long-
run aggregate supply. What could have caused the change you illustrated in part c? List three possible causes.
Rubric for FRQ 1 (8 points)
1 point: Vertical axis labeled “Aggregate price level” (or “Price level”)
1 point: Horizontal axis labeled “Real GDP”
1 point: Vertical curve labeled “LRAS” (or “LRAS1”)
1 point: Potential output labeled YP (or YP1) on the horizontal axis at the intercept of the long-
run aggregate supply curve 1 point: Long-
run aggregate supply curve shifted to the right 1 point: An increase in the quantity of resources (land, labor, capital, or entrepreneurship)
1 point: An increase in the quality of resources
1 point: Technological progress
Question
Draw a correctly labeled short-
run aggregate supply curve. On your graph from part a, illustrate a decrease in short-
run aggregate supply. List three types of changes, including the factor that changes and the direction of the change, that could lead to a decrease in short-
run aggregate supply. (6 points)
Rubric for FRQ 2 (4 points)
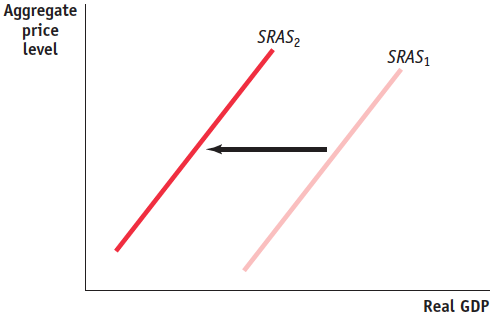
1 point: The vertical axis is labeled “Aggregate price level” or “Price level” and the horizontal axis is labeled “Real GDP.”
1 point: The short-run aggregate supply curve is upward-sloping and labeled.
1 point: A new short-run aggregate supply curve is upward-sloping, labeled, and shown to the left of the original SRAS curve.
1 point each for up to three of the following four answers:
An increase in commodity prices
An increase in nominal wages
A decrease in productivity
An increase in the expected inflation rate