Tackle the Test: Free-Response Questions
Question
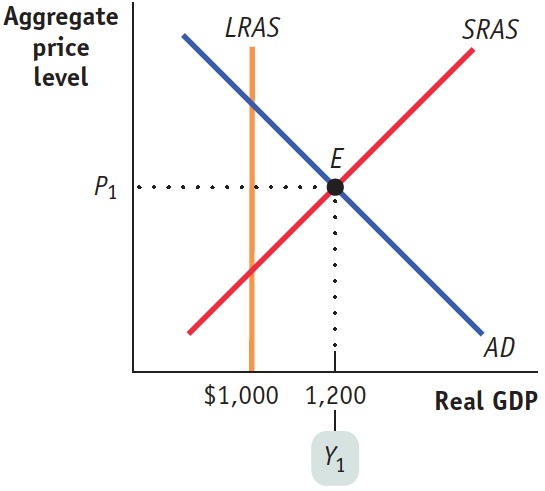
Refer to the graph above, with the economy operating at P1 and Y1.
Is the economy in short-
run macroeconomic equilibrium? Explain. Is the economy in long-
run macroeconomic equilibrium? Explain. What type of gap exists in this economy?
Calculate the size of the output gap.
What will happen to the size of the output gap in the long run?
Rubric for FRQ 1 (7 points)
1 point: Yes
1 point: The economy is in short-
run equilibrium because it operates at the point where short- run aggregate supply and aggregate demand intersect. 1 point: No
1 point: Short-
run equilibrium occurs at a level of aggregate output that is not equal to potential output 1 point: Inflationary gap
1 point: [($1,200 - $1,000)/$1,000] × 100 = 20%
1 point: It will decrease (or approach zero).
Question
Draw a correctly labeled aggregate demand and aggregate supply graph illustrating an economy in long-
run macroeconomic equilibrium. (5 points) Rubric for FRQ 2 (5 points)
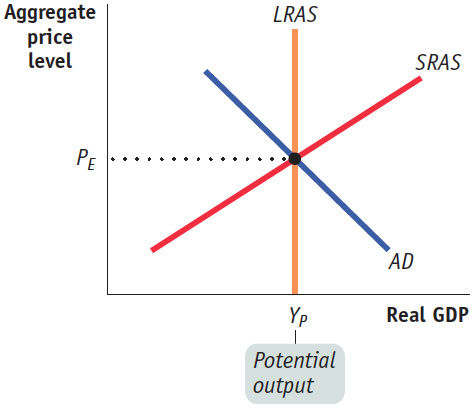
1 point: The vertical axis is labeled “Aggregate price level” or “Price level” and the horizontal axis “Real GDP.”
1 point: The short-run aggregate supply curve is upward-sloping and labeled.
1 point: The aggregate demand curve is downward- sloping and labeled.
1 point: The long-run aggregate supply curve is vertical at potential output.
1 point: The equilibrium price level is shown on the vertical axis where SRAS and AD intersect.