Check Your Understanding
Question
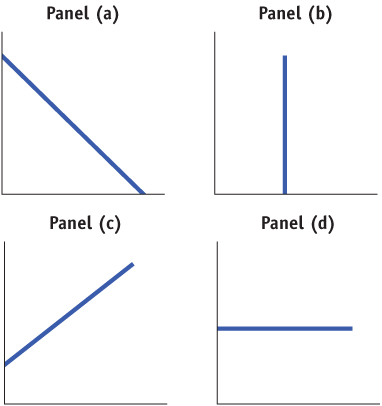
Study the four accompanying diagrams. Consider the following statements and indicate which diagram matches each statement. For each statement, tell which variable would appear on the horizontal axis and which on the vertical. In each of these statements, is the slope positive, negative, zero, or infinity?
If the price of movies increases, fewer consumers go to see movies.
Panel (a) illustrates this relationship. The higher price of movies causes consumers to see fewer movies. The relationship is negative, and the slope is therefore negative. The price of movies is the independent variable, and the number of movies seen the dependent variable. However, there is a convention in economics that if price is a variable, it is measured on the vertical axis. So, the quantity of movies is measured on the horizontal axis.Workers with more experience typically have higher incomes than less experienced workers.
Panel (c) illustrates this relationship. Since it is likely that firms would pay more to workers with more experience, then years of experience is the independent variable that would be shown on the horizontal axis, and the resulting income, the dependent variable, would be shown on the vertical axis. The slope is positive.Regardless of the temperature outside, Americans consume the same number of hot dogs per day.
Panel (d) illustrates this relationship. With the temperature on the horizontal axis as the independent variable, and the consumption of hot dogs on the vertical axis as the dependent variable, we see that no change occurs in hot dog consumption regardless of the temperature. The slope is zero.Consumers buy more frozen yogurt when the price of ice cream goes up.
Panel (c) illustrates this relationship. When the price of ice cream goes up, this causes consumers to choose a close alternative, frozen yogurt. The price of ice cream is the independent variable and the consumption of frozen yogurt the dependent variable. However, there is a convention in economics that if price is a variable, it is measured on the vertical axis. The quantity of frozen yogurt that consumers buy is on the horizontal axis. The slope is positive.Research finds no relationship between the number of diet books purchased and the number of pounds lost by the average dieter.
Panel (d) illustrates this relationship. Because the intent is for diet books to influence the number of pounds lost, the number of diet books is the independent variable and belongs on the horizontal axis. The number of pounds lost is the dependent variable measured on the vertical axis. The absence of a discernible relationship between the number of diet books purchased and the weight loss of the average dieter results in a horizontal curve. The slope is zero.Regardless of its price, there is no change in the quantity of salt that Americans buy.
Panel (b) illustrates this relationship. Although price is the independent variable and salt consumption the dependent variable, by convention the price appears on the vertical axis and the quantity of salt on the horizontal axis. Since salt consumption does not change regardless of the price, the curve is a vertical line, and the slope is infinity.
Question
During the Reagan administration, economist Arthur Laffer argued in favor of lowering income tax rates in order to increase tax revenues. Like most economists, he believed that at tax rates above a certain level, tax revenue would fall (because high taxes would discourage some people from working) and that people would refuse to work at all if they received no income after paying taxes. This relationship between tax rates and tax revenue is graphically summarized in what is widely known as the Laffer curve. Plot the Laffer curve relationship, assuming that it has the shape of a nonlinear curve. The following questions will help you construct the graph.
Which is the independent variable? Which is the dependent variable? On which axis do you therefore measure the income tax rate? On which axis do you measure income tax revenue?
The income tax rate is the independent variable and is measured on the horizontal axis. Income tax revenue is the dependent variable and is measured on the vertical axis.What would tax revenue be at a 0% income tax rate?
If the income tax rate is 0% (there is no tax), tax revenue is zero.The maximum possible income tax rate is 100%. What would tax revenue be at a 100% income tax rate?
If the income tax rate is 100% (all of your income is taxed), you will have no income left after tax. Since people are unwilling to work if they receive no income after tax, no income will be earned. As a result, there is no income tax revenue.Estimates now show that the maximum point on the Laffer curve is (approximately) at a tax rate of 80%. For tax rates less than 80%, how would you describe the relationship between the tax rate and tax revenue, and how is this relationship reflected in the slope? For tax rates higher than 80%, how would you describe the relationship between the tax rate and tax revenue, and how is this relationship reflected in the slope?
For tax rates less than 80%, tax rate and tax revenue are positively related, so the Laffer curve has a positive slope. For tax rates higher than 80%, the relationship between tax rate and tax revenue is negative, so the Laffer curve has a negative slope. Therefore, the Laffer curve looks like the accompanying graph with a maximum point at a tax rate of 80%.