Fiscal Policy: The Basics
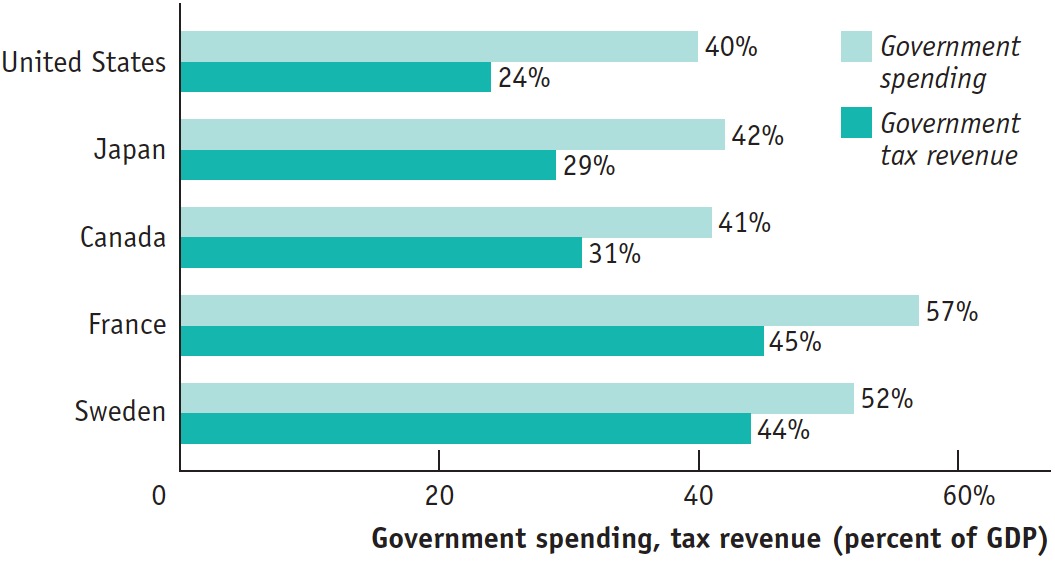
Let’s begin with the obvious: modern governments spend a great deal of money and collect a lot in taxes. Figure 20.1 shows government spending and tax revenue as percentages of GDP for a selection of high-
| Figure 20.1 | Government Spending and Tax Revenue for Some High- |
To analyze these effects, we begin by showing how taxes and government spending affect the economy’s flow of income. Then we can see how changes in spending and tax policy affect aggregate demand.
Taxes, Government Purchases of Goods and Services, Transfers, and Borrowing
AP® Exam Tip
When the government increases spending or transfer payments or decreases taxes (to give consumers more income), the economy expands. When the government decreases spending or transfer payments or increases taxes, the economy contracts.
In the circular-
What kinds of taxes do Americans pay, and where does the money go? Figure 20.2 shows the composition of U.S. tax revenue in 2013. Taxes, of course, are required payments to the government. In the United States, taxes are collected at the national level by the federal government; at the state level by each state government; and at local levels by counties, cities, and towns. At the federal level, the main taxes are income taxes on both personal income and corporate profits as well as social insurance taxes, which we’ll explain shortly. At the state and local levels, the picture is more complex: these governments rely on a mix of sales taxes, property taxes, income taxes, and fees of various kinds. Overall, taxes on personal income and corporate profits accounted for 43% of total government revenue in 2013; social insurance taxes accounted for 24%; and a variety of other taxes, collected mainly at the state and local levels, accounted for the rest.
| Figure 20.2 | Sources of Tax Revenue in the United States, 2013 |
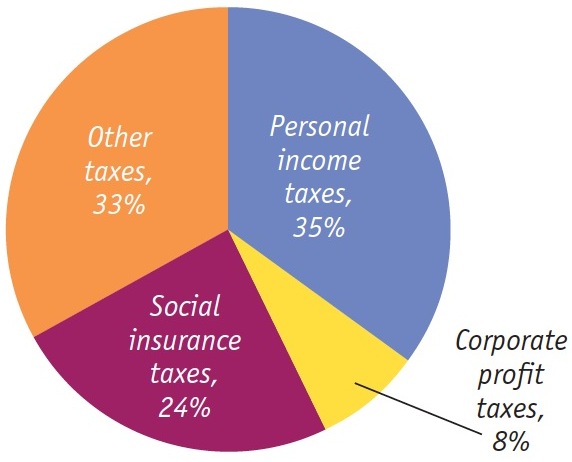
Figure 20.3 shows the composition of total U.S. government spending in 2013, which takes two forms. One form is purchases of goods and services. This includes everything from ammunition for the military to the salaries of public schoolteachers (who are treated in the national accounts as providers of a service—
| Figure 20.3 | Government Spending in the United States, 2013 |
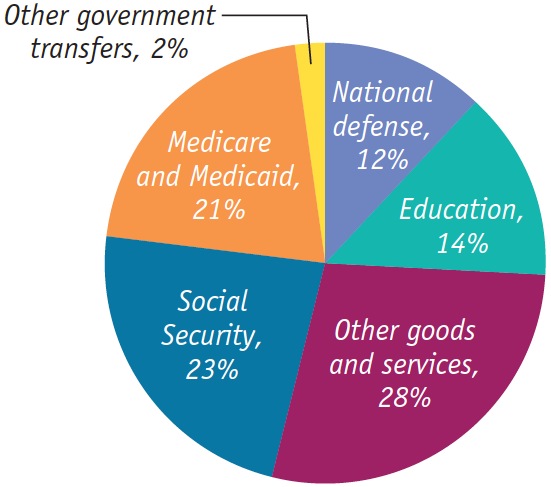
The other form of government spending is government transfers, which are payments by the government to households for which no good or service is provided in return. In the modern United States, as well as in Canada and Europe, government transfers represent a very large proportion of the budget. Most U.S. government spending on transfer payments is accounted for by three big programs:
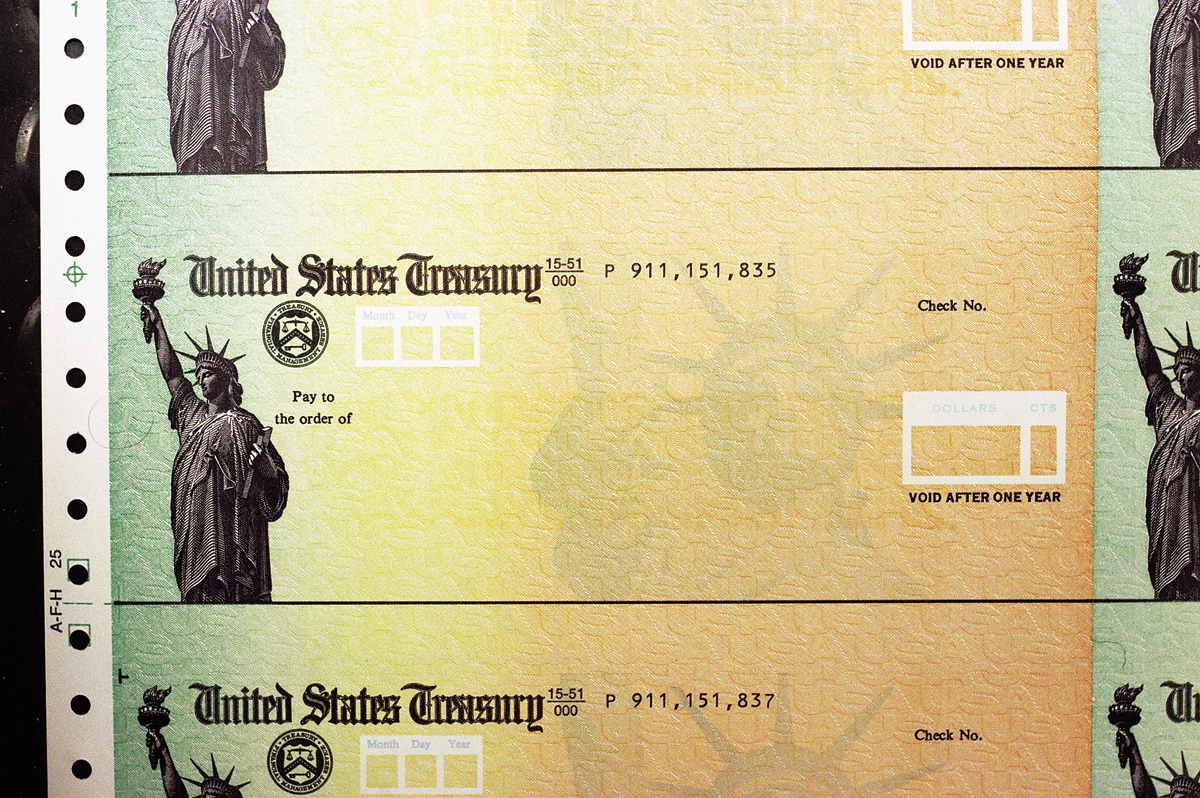
Social Security, which provides guaranteed income to older Americans, disabled Americans, and the surviving spouses and dependent children of deceased beneficiaries
Medicare, which covers much of the cost of health care for Americans over age 65
Medicaid, which covers much of the cost of health care for Americans with low incomes
Social insurance programs are government programs intended to protect families against economic hardship.
The term social insurance is used to describe government programs that are intended to protect families against economic hardship. These include Social Security, Medicare, and Medicaid, as well as smaller programs such as unemployment insurance and food stamps. In the United States, social insurance programs are largely paid for with special, dedicated taxes on wages—
But how do tax policy and government spending affect the economy? The answer is that taxation and government spending have a strong effect on aggregate spending.
The Government Budget and Total Spending
Let’s recall the basic equation of national income accounting:
The left-
The government directly controls one of the variables on the right-
To see why the budget affects consumer spending, recall that disposable income, the total income households have available to spend, is equal to the total income they receive from wages, dividends, interest, and rent, minus taxes, plus government transfers. So either an increase in taxes or a decrease in government transfers reduces disposable income. And a fall in disposable income, other things equal, leads to a fall in consumer spending. Conversely, either a decrease in taxes or an increase in government transfers increases disposable income. And a rise in disposable income, other things equal, leads to a rise in consumer spending.
The government’s ability to affect investment spending is a more complex story, which we won’t discuss in detail. The important point is that the government taxes profits, and changes in the rules that determine how much a business owes can increase or decrease the incentive to spend on investment goods.
Because the government itself is one source of spending in the economy, and because taxes and transfers can affect spending by consumers and firms, the government can use changes in taxes or government spending to shift the aggregate demand curve, and there can be good reasons for doing so. In early 2008, for example, there was bipartisan agreement that the U.S. government should act to prevent a fall in aggregate demand—
Expansionary and Contractionary Fiscal Policy
Why would the government want to shift the aggregate demand curve? Because it wants to close either a recessionary gap, created when aggregate output falls below potential output, or an inflationary gap, created when aggregate output exceeds potential output.
Expansionary fiscal policy increases aggregate demand.
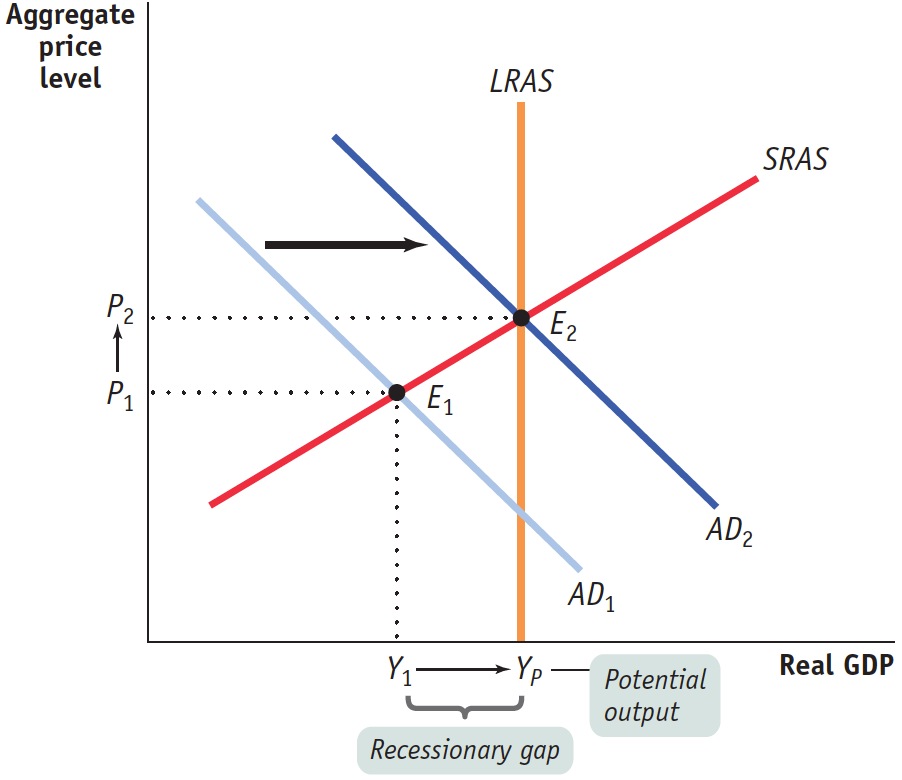
Figure 20.4 shows the case of an economy facing a recessionary gap. SRAS is the short-
an increase in government purchases of goods and services
a cut in taxes
an increase in government transfers
| Figure 20.4 | Expansionary Fiscal Policy Can Close a Recessionary Gap |
AP® Exam Tip
If a question on the AP® exam asks you to identify a policy that would be appropriate to close a recessionary gap or an inflationary gap, don’t simply say “expansionary” or “contractionary.” Your answer should specify a policy (a change in spending, transfer payments, or taxes) that would close the gap described in the question.
Contractionary fiscal policy reduces aggregate demand.
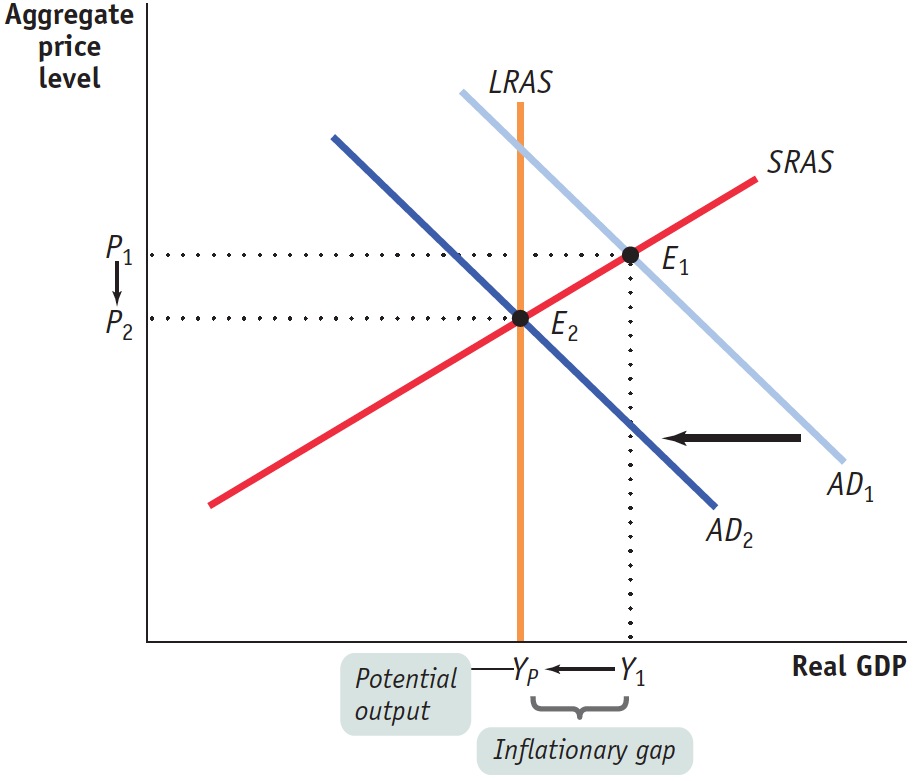
Figure 20.5 shows the opposite case—
a reduction in government purchases of goods and services
an increase in taxes
a reduction in government transfers
| Figure 20.5 | Contractionary Fiscal Policy Can Close an Inflationary Gap |
A classic example of contractionary fiscal policy occurred in 1968, when U.S. policy makers grew worried about rising inflation. President Lyndon Johnson imposed a temporary 10% surcharge on income taxes—
A Cautionary Note: Lags in Fiscal Policy
Looking at Figures 20.4 and 20.5, it may seem obvious that the government should actively use fiscal policy—
We’ll leave discussion of the warnings associated with monetary policy to later modules. In the case of fiscal policy, one key reason for caution is that there are important time lags in its use. To understand the nature of these lags, think about what has to happen before the government increases spending to fight a recessionary gap. First, the government has to realize that the recessionary gap exists: economic data take time to collect and analyze, and recessions are often recognized only months after they have begun. Second, the government has to develop a spending plan, which can itself take months, particularly if politicians take time debating how the money should be spent and passing legislation. Finally, it takes time to spend money. For example, a road construction project begins with activities such as surveying that don’t involve spending large sums. It may be quite some time before the big spending begins.
Because of these lags, an attempt to increase spending to fight a recessionary gap may take so long to get going that the economy has already recovered on its own. In fact, the recessionary gap may have turned into an inflationary gap by the time the fiscal policy takes effect. In that case, the fiscal policy will make things worse instead of better.
This doesn’t mean that fiscal policy should never be actively used. In early 2008, for example, there was good reason to believe that the U.S. economy had begun a lengthy slowdown caused by turmoil in the financial markets, so a fiscal stimulus designed to arrive within a few months would almost surely push aggregate demand in the right direction. But the problem of lags makes the actual use of both fiscal and monetary policy harder than you might think from a simple analysis like the one we have just given.