The Business Cycle
The business cycle is the alternation between economic downturns, known as recessions, and economic upturns, known as expansions.
A depression is a very deep and prolonged downturn.
Recessions are periods of economic downturns when output and employment are falling.
Expansions, or recoveries, are periods of economic upturns when output and employment are rising.
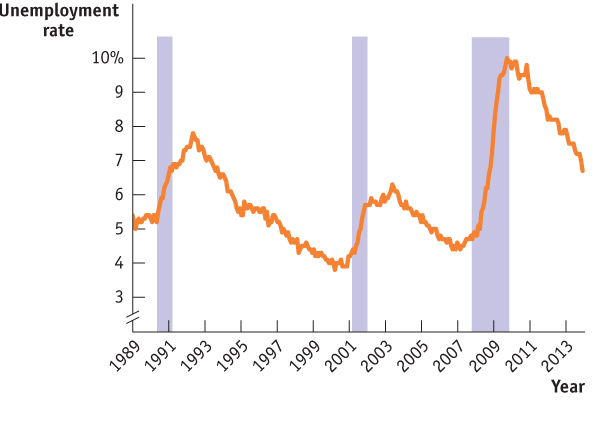
The alternation between economic downturns and upturns in the macroeconomy is known as the business cycle. A depression is a very deep and prolonged downturn; fortunately, the United States hasn’t had one since the Great Depression of the 1930s. Instead, we have experienced less prolonged economic downturns known as recessions, periods in which output and employment are falling. These are followed by economic upturns—
| Figure 2.1 | The U.S. Unemployment Rate and the Timing of Business Cycles, 1989– |
AP® Exam Tip
Be prepared to identify the different phases of the business cycle so you can relate each phase to changes in employment, output, and growth.
The business cycle is an enduring feature of the economy. But even though ups and downs seem to be inevitable, most people believe that macroeconomic analysis has guided policies that help smooth out the business cycle and stabilize the economy.
What happens during a business cycle, and how can macroeconomic policies address the downturns? Let’s look at three issues: employment and unemployment, aggregate output, and inflation and deflation.
Employment, Unemployment, and the Business Cycle
Although not as severe as a depression, a recession is clearly an undesirable event. Like a depression, a recession leads to joblessness, reduced production, reduced incomes, and lower living standards.
Employment is the number of people who are currently working for pay in the economy.
Unemployment is the number of people who are actively looking for work but aren’t currently employed.
The labor force is equal to the sum of employment and unemployment.
To understand how job loss relates to the adverse effects of recessions, we need to understand something about how the labor force is structured. Employment is the total number of people who are currently working for pay, and unemployment is the total number of people who are actively looking for work but aren’t currently employed. A country’s labor force is the sum of employment and unemployment.
Defining Recessions and Expansions
Defining Recessions and Expansions
Some readers may be wondering exactly how recessions and expansions are defined. The answer is that there is no exact definition!
In many countries, economists adopt the rule that a recession is a period of at least two consecutive quarters (a quarter is three months), during which aggregate output falls. The two-
Sometimes, however, this definition seems too strict. For example, an economy that has three months of sharply declining output, then three months of slightly positive growth, then another three months of rapid decline, should surely be considered to have endured a nine-
In the United States, we try to avoid such misclassifications by assigning the task of determining when a recession begins and ends to an independent panel of experts at the National Bureau of Economic Research (NBER). This panel looks at a variety of economic indicators, with the main focus on employment and production, but ultimately, the panel makes a judgment call.
Sometimes this judgment is controversial. In fact, there is lingering controversy over the 2001 recession. According to the NBER, that recession began in March 2001 and ended in November 2001, when output began rising. Some critics argue, however, that the recession really began several months earlier, when industrial production began falling. Other critics argue that the recession didn’t really end in 2001 because employment continued to fall and the job market remained weak for another year and a half.
The unemployment rate is the percentage of the labor force that is unemployed.
The unemployment rate—the percentage of the labor force that is unemployed—
Aggregate Output and the Business Cycle
Output is the quantity of goods and services produced.
Aggregate output is the economy’s total production of goods and services for a given time period.
Rising unemployment is the most painful consequence of a recession, and falling unemployment the most urgently desired feature of an expansion. But the business cycle isn’t just about jobs—
Inflation, Deflation, and Price Stability
In 1970 the average production worker in the United States was paid $3.40 an hour. By October 2013 the average hourly earnings for such a worker had risen to $19.65. Three cheers for economic progress!
But wait—
A rising overall price level is inflation.
A falling overall price level is deflation.
Between 1970 and 2013, the economy experienced substantial inflation, a rise in the overall price level. The opposite of inflation is deflation, a fall in the overall price level. A change in the prices of a few goods changes the opportunity cost of purchasing those goods but does not constitute inflation or deflation. These terms are reserved for more general changes in the prices of goods and services throughout the economy.
Both inflation and deflation can pose problems for the economy. Inflation discourages people from holding on to cash, because if the price level is rising, cash loses value. That is, if the price level rises, a dollar will buy less than it would before. As we will see later in our more detailed discussion of inflation, in periods of rapidly rising prices, people stop holding cash altogether and instead trade goods for goods.
Deflation can cause the opposite problem. That is, if the overall price level falls, a dollar will buy more than it would before. In this situation it can be more attractive for people with cash to hold on to it rather than to invest in new factories and other productive assets. This can deepen a recession.
The economy has price stability when the overall price level is changing only slowly if at all.
In later modules we will look at other costs of inflation and deflation. For now, note that economists have a general goal of price stability—meaning that the overall price level is changing only slowly if at all—