Long-Run Implications of Fiscal Policy
Government debt is the accumulation of past budget deficits, minus past budget surpluses.
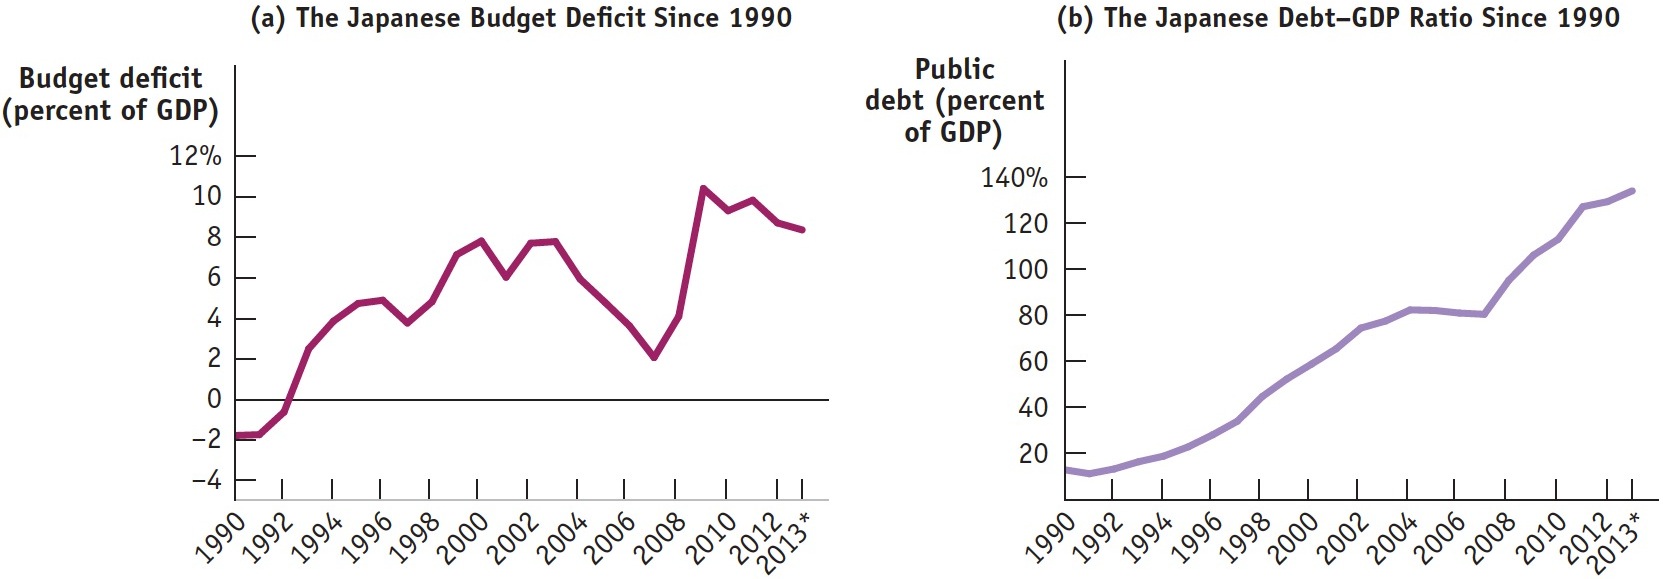
During the 1990s, the Japanese government engaged in massive deficit spending in an effort to increase aggregate demand. That policy was partly successful: although Japan’s economy was sluggish during the 1990s, it avoided a severe slump comparable to what happened to many countries in the 1930s. Yet the fact that Japan was running large budget deficits year after year made many observers uneasy, as Japan’s government debt—the accumulation of past budget deficits, minus past budget surpluses—
Deficits, Surpluses, and Debt
When a family spends more than it earns over the course of a year, it has to raise the extra funds either by selling assets or by borrowing. And if a family borrows year after year, it will eventually end up with a lot of debt.
AP® Exam Tip
A budget deficit occurs when the government’s revenue is less than its spending in a given year.
The same is true for governments. With a few exceptions, governments don’t raise large sums by selling assets such as national parkland. Instead, when a government spends more than the tax revenue it receives—
A fiscal year runs from October 1 to September 30 and is labeled according to the calendar year in which it ends.
To interpret the numbers that follow, you need to know a slightly peculiar feature of federal government accounting. For historical reasons, the U.S. government does not keep the books by calendar years. Instead, budget totals are kept by fiscal years, which run from October 1 to September 30 and are labeled by the calendar year in which they end. For example, fiscal 2013 began on October 1, 2012, and ended on September 30, 2013.
Public debt is government debt held by individuals and institutions outside the government.
At the end of fiscal 2013, the total debt of the U.S. federal government was $16.7 trillion, or about 100% of gross domestic product. However, part of that debt represented special accounting rules specifying that the federal government as a whole owes funds to certain government programs, especially Social Security. We’ll explain those rules shortly. For now, however, let’s focus on public debt: government debt held by individuals and institutions outside the government. At the end of fiscal 2013, the federal government’s public debt was “only” $12.0 trillion, or about 72% of GDP. If we include the debts of state and local governments, total government public debt was approximately 88% of GDP.
U.S. federal government public debt at the end of fiscal 2013 was larger than it was at the end of fiscal 2012 because the federal government ran a budget deficit during fiscal 2013. A government that runs persistent budget deficits will experience a rising level of debt. Why is this a problem?
Problems Posed by Rising Government Debt
There are two reasons to be concerned when a government runs persistent budget deficits. We described one reason previously: when the economy is at potential output and the government borrows funds in the financial markets, it is competing with firms that plan to borrow funds for investment spending. As a result, the government’s borrowing may crowd out private investment spending, thereby increasing interest rates and reducing the economy’s long-
The second reason: today’s deficits, by increasing the government’s debt, place financial pressure on future budgets. The impact of current deficits on future budgets is straightforward. Like individuals, governments must pay their bills, including interest payments on their accumulated debt. When a government is deeply in debt, those interest payments can be substantial. In fiscal 2013, the U.S. federal government paid 2.4% of GDP—
Other things equal, a government paying large sums in interest must raise more revenue from taxes or spend less than it would otherwise be able to afford—

The idea of a government defaulting sounds far-
Default creates havoc in a country’s financial markets and badly shakes public confidence in both the government and the economy. For example, Argentina’s debt default was accompanied by a crisis in the country’s banking system and a very severe recession. And even if a highly indebted government avoids default, a heavy debt burden typically forces it to slash spending or raise taxes, politically unpopular measures that can also damage the economy.
One question some people ask is: can’t a government that has trouble borrowing just print money to pay its bills? Yes, it can, but this leads to another problem: inflation. In fact, budget problems are the main cause of very severe inflation, as we’ll see later. The point for now is that governments do not want to find themselves in a position where the choice is between defaulting on their debts and inflating those debts away.
Concerns about the long-
Deficits and Debt in Practice
Figure 30.4 shows how the U.S. federal government’s budget deficit and its debt have evolved since 1940. Panel (a) shows the federal deficit as a percentage of GDP. As you can see, the federal government ran huge deficits during World War II. It briefly ran surpluses after the war, but it has normally run deficits ever since, especially after 1980. This seems inconsistent with the advice that governments should offset deficits in bad times with surpluses in good times.
| Figure 30.4 | U.S. Federal Deficits and Debt |
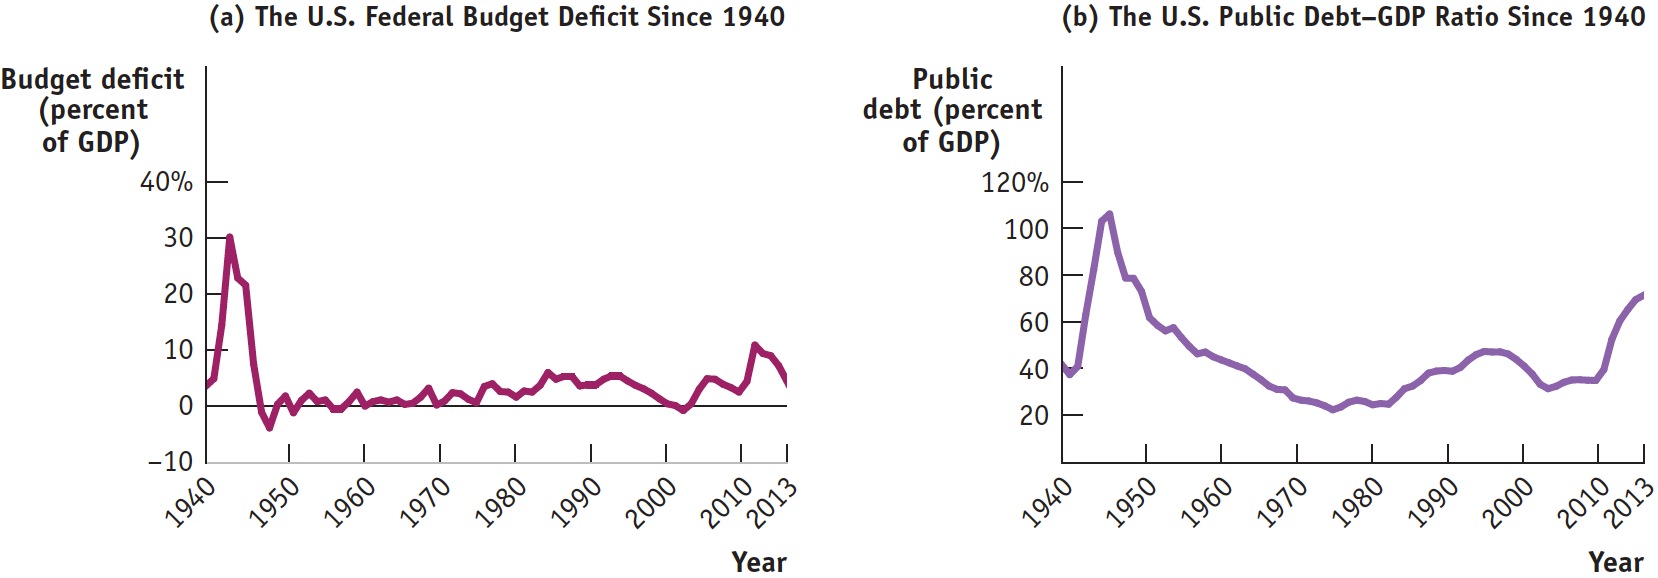
The debt–
However, panel (b) of Figure 30.4 shows that these deficits have not led to runaway debt. To assess the ability of governments to pay their debt, we often use the debt–
What we see from panel (b) is that, although the federal debt has grown in almost every year, the debt–
Still, a government that runs persistent large deficits will have a rising debt–
| Figure 30.5 | Japanese Deficits and Debt |
Implicit Liabilities
Implicit liabilities are spending promises made by governments that are effectively a debt despite the fact that they are not included in the usual debt statistics.
Looking at Figure 30.4, you might be tempted to conclude that, until the 2008 economic crisis struck, the U.S. federal budget was in fairly decent shape: the return to budget deficits after 2001 caused the debt–
What Happened to the Debt from World War II?
What Happened to the Debt from World War II?
As you can see from Figure 30.4, the government paid for World War II by borrowing on a huge scale. By the war’s end, the public debt was more than 100% of GDP, and many people worried about how it could ever be paid off.
The truth is that it never was paid off. In 1946, the public debt was $242 billion; that number dipped slightly in the next few years, as the United States ran postwar budget surpluses, but the government budget went back into deficit in 1950 with the start of the Korean War. By 1962, the public debt was back up to $248 billion.
But by that time nobody was worried about the fiscal health of the U.S. government because the debt–
The largest implicit liabilities of the U.S. government arise from two transfer programs that principally benefit older Americans: Social Security and Medicare. The third-
The implicit liabilities created by these transfer programs worry fiscal experts. Figure 30.6 shows why. It shows actual spending on Social Security and on Medicare and Medicaid as percentages of GDP from 1980 to 2013, with Congressional Budget Office projections of spending through 2085. According to these projections, spending on Social Security will rise substantially over the next few decades and spending on the two health care programs will soar. Why?
| Figure 30.6 | Future Demands on the Federal Budget |
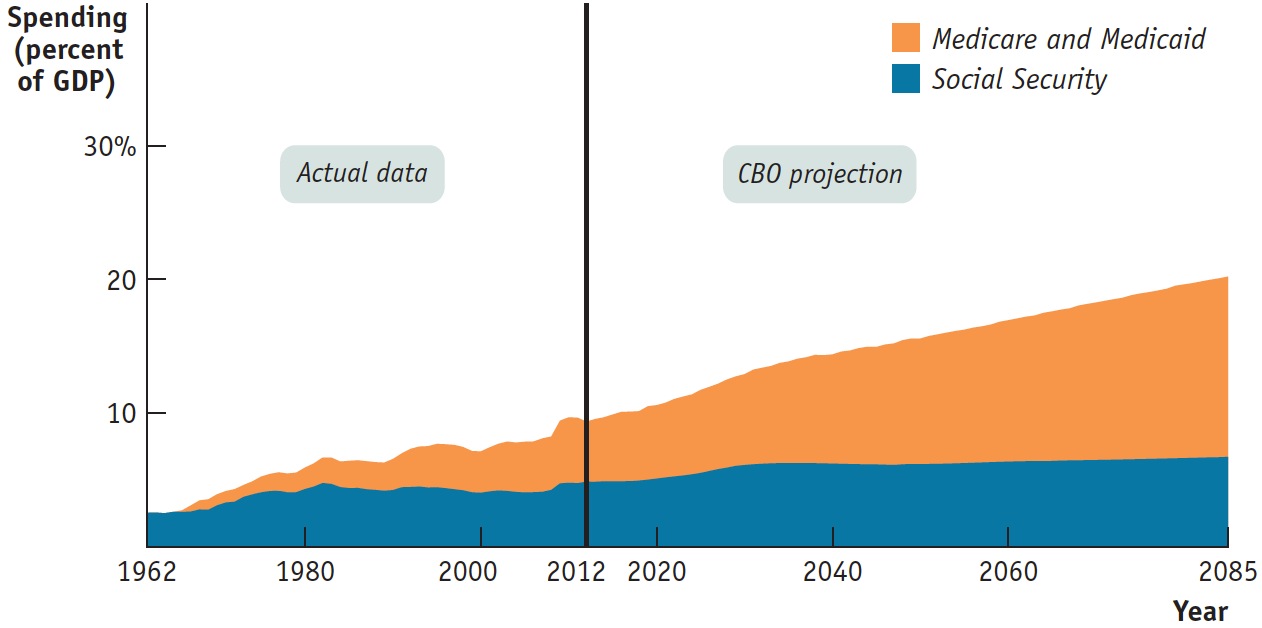
In the case of Social Security, the answer is demography. Social Security is a “pay-
The aging of the baby boomers, by itself, poses a problem, but the projected rise in Medicare and Medicaid spending is a much more serious concern. The main story behind projections of higher Medicare and Medicaid spending is the long-
To some extent, the implicit liabilities of the U.S. government are already reflected in debt statistics. We mentioned earlier that the government had a total debt of $16.7 trillion at the end of fiscal 2013, but that only $12.0 trillion of that total was owed to the public. The main explanation for that discrepancy is that both Social Security and part of Medicare (the hospital insurance program) are supported by dedicated taxes: their expenses are paid out of special taxes on wages. At times, these dedicated taxes yield more revenue than is needed to pay current benefits. In particular, since the mid-
The money in the trust fund is held in the form of U.S. government bonds, which are included in the $16.7 trillion in total debt. You could say that there’s something funny about counting bonds in the Social Security trust fund as part of government debt. After all, these bonds are owed by one part of the government (the government outside the Social Security system) to another part of the government (the Social Security system itself). But the debt corresponds to a real, if implicit, liability: promises by the government to pay future retirement benefits. So, many economists argue that the gross debt of $16.7 trillion, the sum of public debt and government debt held by Social Security and other trust funds, is a more accurate indication of the government’s fiscal health than the smaller amount owed to the public alone.