Monetary Policy and the Interest Rate
AP® Exam Tip
Don’t confuse the federal funds rate with the discount rate. The Fed can only target the federal funds rate because it is set through the interaction of supply and demand.
Let’s examine how the Federal Reserve can use changes in the money supply to change the interest rate. Figure 31.1 shows what happens when the Fed increases the money supply from  to
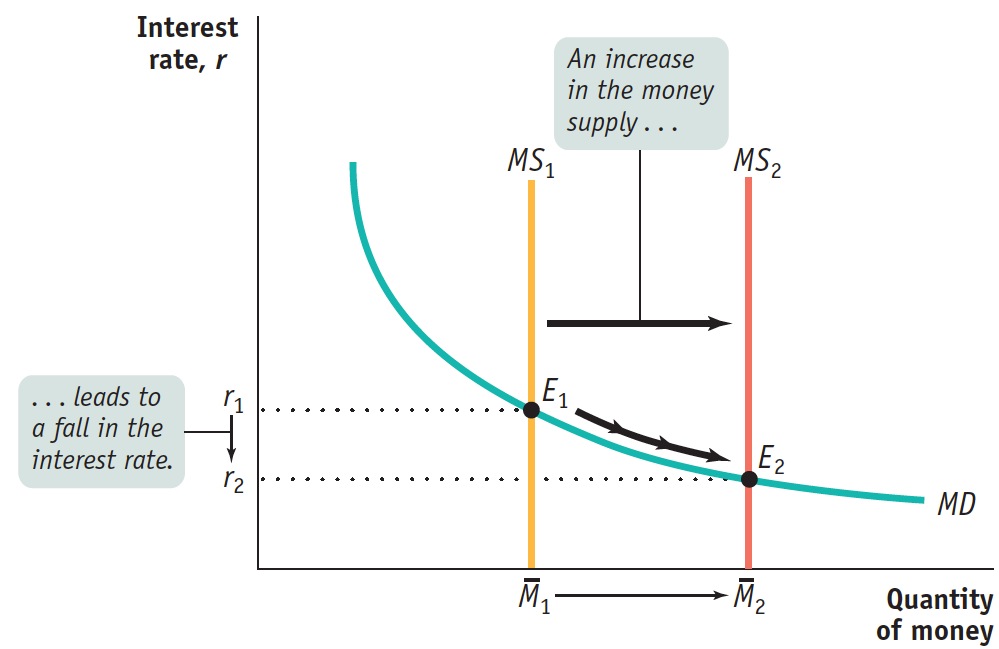
to  . The economy is originally in equilibrium at E1, with the equilibrium interest rate r1 and the money supply . When the Fed increases the money supply to , the money supply curve shifts to the right, from MS1 to MS2, and the equilibrium interest rate falls to r2. Why? Because r2 is the only interest rate at which the public is willing to hold the quantity of money actually supplied, . So an increase in the money supply drives the interest rate down. Similarly, a reduction in the money supply drives the interest rate up. By adjusting the money supply up or down, the Fed can set the interest rate.
| Figure 31.1 | The Effect of an Increase in the Money Supply on the Interest Rate |
 to
to  . In order to induce people to hold the larger quantity of money, the interest rate must fall from r1 to r2.
The Federal Reserve can move the interest rate through open-
In practice, at each meeting the Federal Open Market Committee decides on the interest rate to prevail for the next six weeks, until its next meeting. The Fed sets a target federal funds rate, a desired level for the federal funds rate. This target is then enforced by the Open Market Desk of the Federal Reserve Bank of New York, which adjusts the money supply through open-
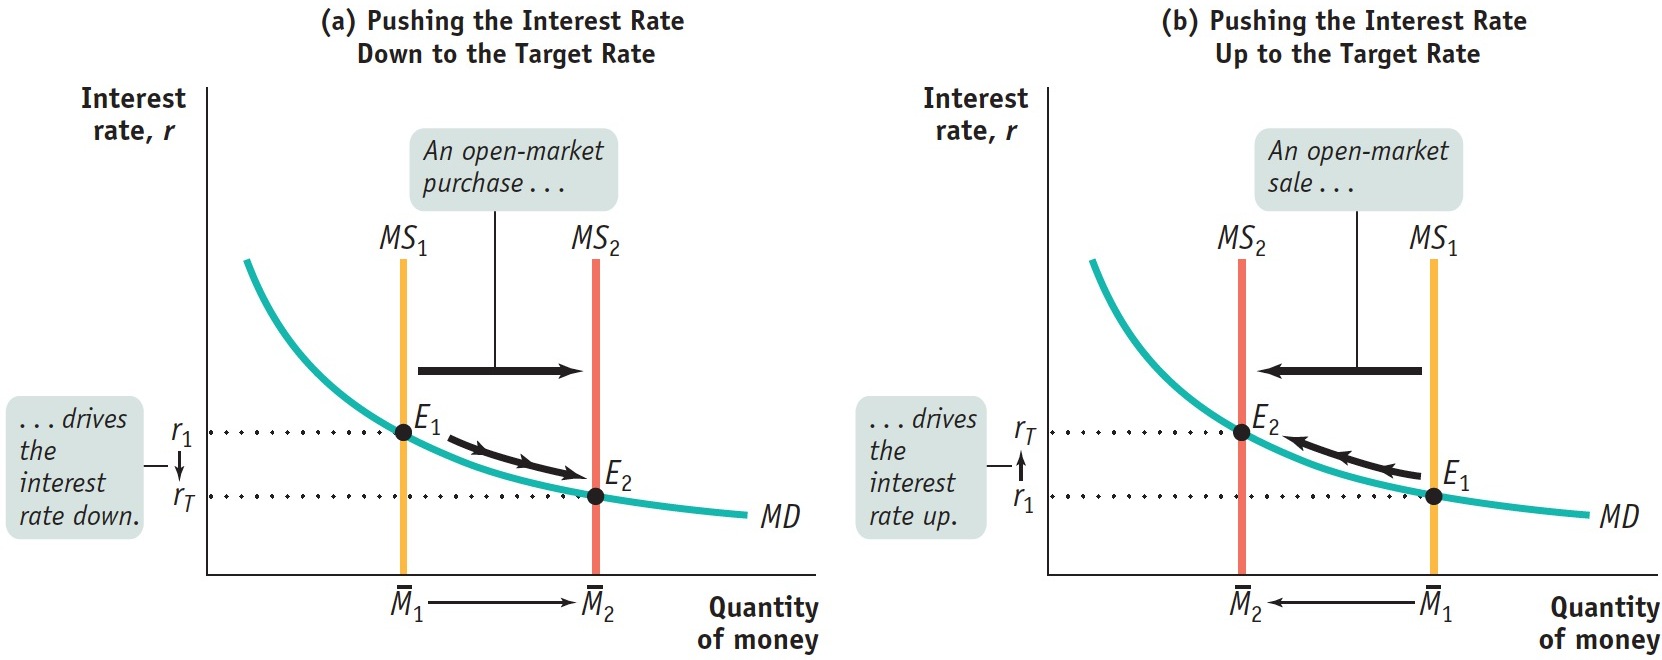
Figure 31.2 shows how interest rate targeting works. In both panels, rT is the target federal funds rate. In panel (a), the initial money supply curve is MS1 with money supply , and the equilibrium interest rate, r1, is above the target rate. To lower the interest rate to rT , the Fed makes an open-. This drives the equilibrium interest rate down to the target rate, rT .
| Figure 31.2 | Setting the Federal Funds Rate |
The Fed Reverses Course
The Fed Reverses Course
During the summer of 2007, many called for a change in Federal Reserve policy. At first the Fed remained unmoved. On August 7, 2007, the Federal Open Market Committee decided to make no change in its interest rate policy. The official statement, however, did concede that “financial markets have been volatile in recent weeks” and that “credit conditions have become tighter for some households and businesses.”
Just three days later, the Fed issued a special statement basically assuring market players that it was paying attention; on August 17 it issued another statement declaring that it was “monitoring the situation,” which is Fed-
It was the beginning of a major change in monetary policy. The figure below shows two interest rates from the beginning of 2004 to 2013: the target federal funds rate decided by the Federal Open Market Committee, which dropped in a series of steps starting in September 2007, and the average effective rate that prevailed in the market each day. The figure shows that the interest rate cut six weeks after Cramer’s diatribe was only the first of several cuts. As you can see, this was a reversal of previous policy: previously the Fed had generally been raising rates, not reducing them, out of concern that inflation might become a problem. But starting in September 2007, fighting the financial crisis took priority. By the way, notice how beginning late in 2008, it looks as if there are two target federal funds rates. What happened? The Federal Open Market Committee set a target range for the federal funds rate, between 0% and 0.25%. That target range was still in effect at the time of writing in 2014.
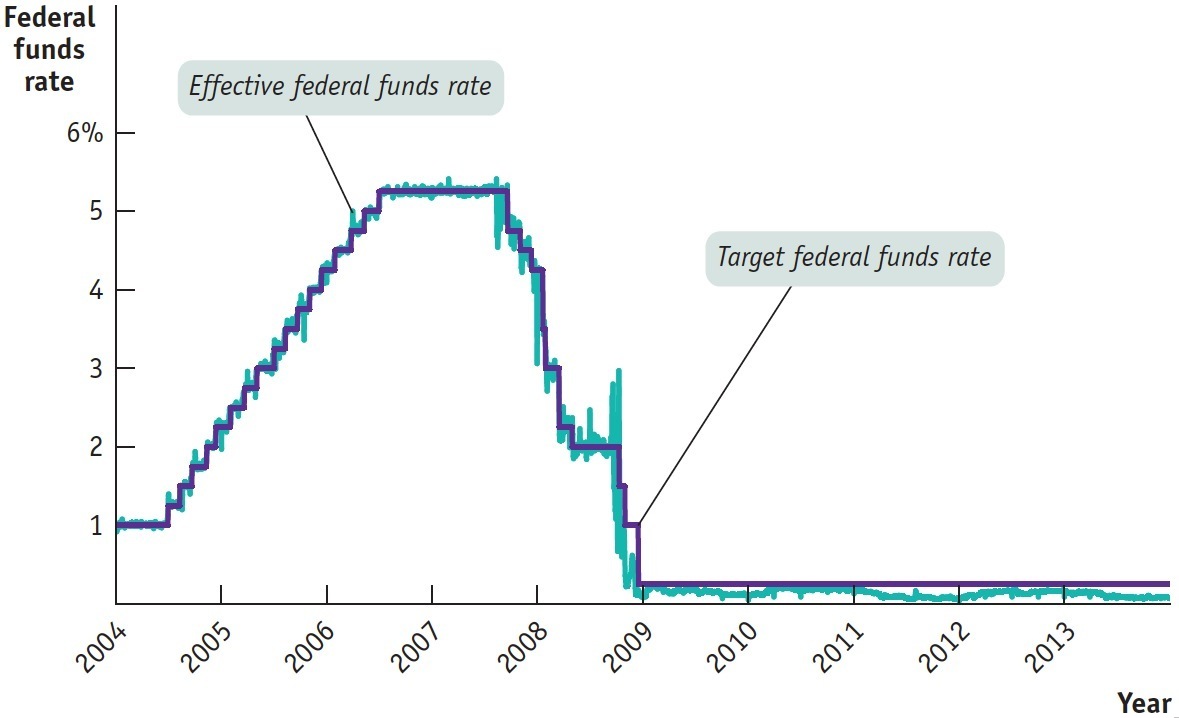
The figure also shows that the Fed doesn’t always hit its target. There were a number of days, especially in 2008, when the actual federal funds rate was significantly above or below the target rate. But these episodes didn’t last long, and overall the Fed got what it wanted, at least as far as short-
Panel (b) shows the opposite case. Again, the initial money supply curve is MS1 with money supply . But this time the equilibrium interest rate, r1, is below the target federal funds rate, rT. In this case, the Fed will make an open- via the money multiplier. The money supply curve shifts leftward from MS1 to MS2, driving the equilibrium interest rate up to the target federal funds rate, rT .