Tackle the Test: Free-Response Questions
Question
Give the equation for the Taylor rule.
How well does the Taylor rule fit the Fed’s actual behavior? Explain.
Suppose the inflation rate is 1% and the output gap is 3%. What federal funds rate does the Taylor rule predict?
Suppose the inflation rate increases by 2 percentage points. If the Fed follows the Taylor rule, what specific change in the target federal funds rate will the Fed seek? Identify the general type of policy the Fed uses to achieve that sort of change.
Rubric for FRQ 1 (6 points)
1 point: Federal funds rate = 1 + (1.5 × inflation rate) + (0.5 × output gap)
1 point: It’s not a perfect fit but it is usually a close approximation.
1 point: It does better than any one measure alone, and it has always correctly predicted the direction of change of interest rates.
1 point: 1 + (1.5 × 1) + (0.5 × 3) = 4%
1 point: An increase of 3 (1.5 × 2) percentage points
1 point: Contractionary monetary policy
Question
What can the Fed do with each of its three primary tools to implement expansionary monetary policy during a recession?
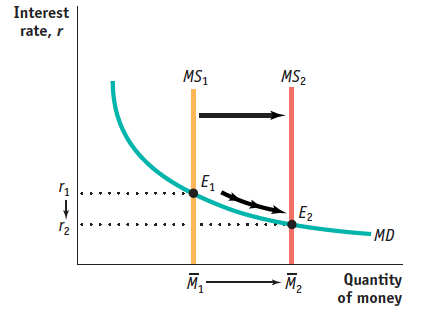
Use a correctly labeled graph of the money market to explain how the Fed’s use of expansionary monetary policy affects interest rates in the short run.
Explain how the interest rate change you graphed in part b affects aggregate supply and demand in the short run.
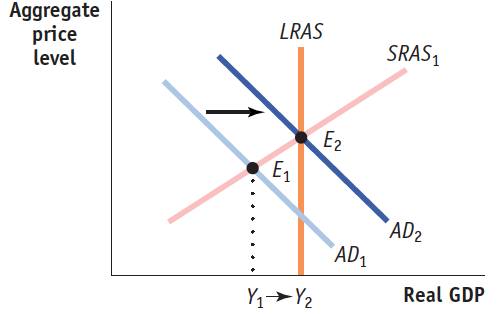
Use a correctly labeled aggregate demand and supply graph to show how expansionary monetary policy affects aggregate output in the short run. (11 points)
Rubric for FRQ 2 (6 points)
1 point: Decrease the discount rate.
1 point: Decrease the reserve requirement.
1 point: Buy Treasury bills.

1 point: Graph labeled “Interest rate” on the vertical axis, “Quantity of money” on the horizontal axis, and a downward-sloping money demand curve
1 point: Vertical money supply curve
1 point: Rightward shift of money supply curve and corresponding decrease in the equilibrium interest rate
1 point: The interest rate change does not affect aggregate supply in the short run.
1 point: Aggregate demand increases because the lower interest rate leads to more investment spending, and investment is a component of aggregate demand.

1 point: Graph labeled “Aggregate price level” or “PL” on the vertical axis and “Real GDP” on the horizontal axis with downward-sloping AD, upward-sloping SRAS, and an initial equilibrium to the left of the vertical LRAS
1 point: Rightward shift of aggregate demand
1 point: Indication that real GDP increases on the figure, as from Y1 to Y2