Tackle the Test: Free-Response Questions
Question
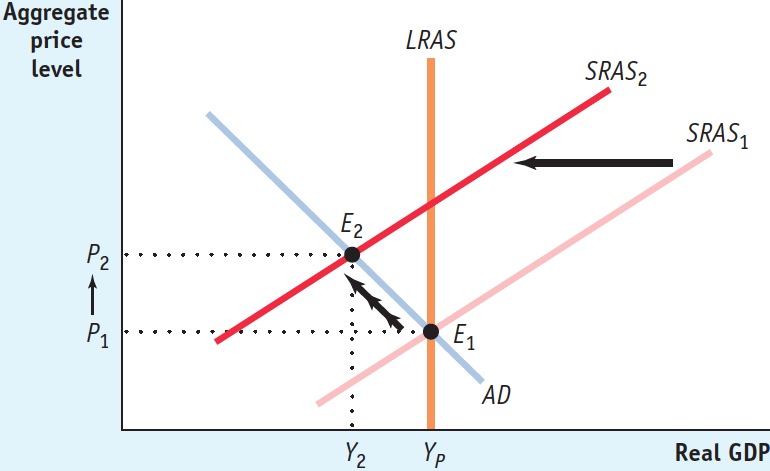
Use a correctly labeled aggregate demand and aggregate supply graph to illustrate cost-
push inflation. Give an example of what might cause cost- push inflation in the economy. Rubric for FRQ 1 (9 points)
1 point: Graph labeled “Aggregate price level” or “PL” on the vertical axis and “Real GDP” on the horizontal axis
1 point: AD downward-
sloping and labeled 1 point: SRAS upward-
sloping and labeled 1 point: LRAS vertical and labeled
1 point: Potential output labeled at horizontal intercept of LRAS
1 point: Long-
run macroeconomic equilibrium aggregate price level labeled on vertical axis at intersection of SRAS, LRAS, and AD 1 point: Leftward shift of the SRAS curve
1 point: Higher equilibrium aggregate price level at new intersection of SRAS and AD
1 point: This could be caused by anything that would shift the short-
run aggregate supply curve to the left, such as an increase in the price of energy, labor, or another input with economy- wide importance. Question
Draw a correctly labeled aggregate demand and aggregate supply graph showing an economy in long-
run macroeconomic equilibrium. On your graph, show the effect of an increase in the money supply, according to the classical model of the price level.(4 points) Rubric for FRQ 2 (4 points)
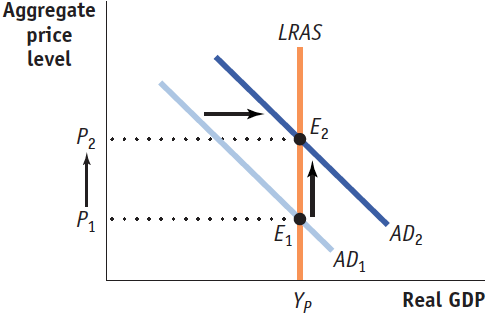
1 point: Graph labeled “Aggregate price level” or “PL” on the vertical axis and “Real GDP” on the horizontal axis with a downward-sloping AD
1 point: Vertical LRAS . If there is also an SRAS curve, it must intersect the AD curve at the same point where the AD curve intersects the LRAS curve.
1 point: Rightward shift of aggregate demand
1 point: Indication that the price level increases, but there is no increase in real GDP