Comparing Economies Across Time and Space
Before we analyze the sources of long-
Real GDP per Capita
The key statistic used to track economic growth is real GDP per capita—real GDP divided by the population size. We focus on GDP because, as we have learned, GDP measures the total value of an economy’s production of final goods and services as well as the income earned in that economy in a given year. We use real GDP because we want to separate changes in the quantity of goods and services from the effects of a rising price level. We focus on real GDP per capita because we want to isolate the effect of changes in the population. For example, other things equal, an increase in the population lowers the standard of living for the average person—
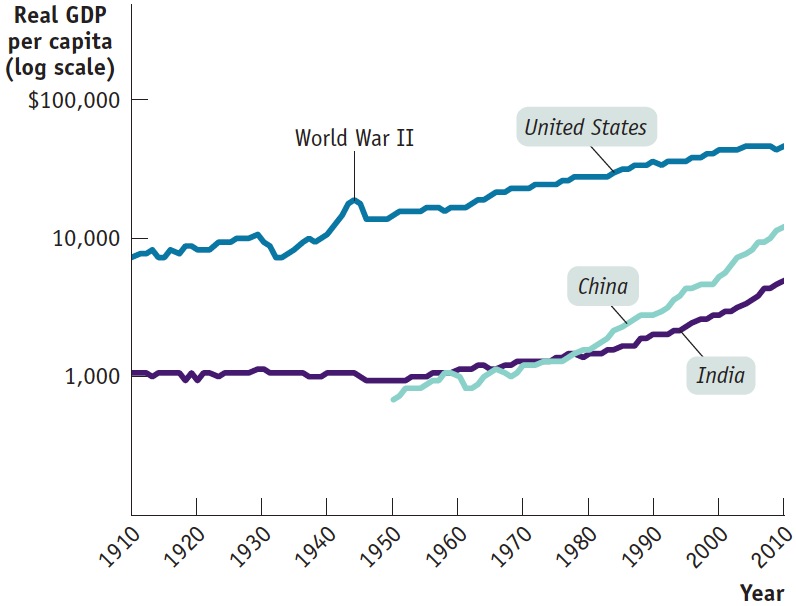
Although we learned that growth in real GDP per capita should not be a policy goal in and of itself, it does serve as a very useful summary measure of a country’s economic progress over time. Figure 37.1 shows real GDP per capita for the United States, India, and China, measured in 2005 dollars, from 1910 to 2010. (We’ll talk about India and China in a moment.) The vertical axis is drawn on a logarithmic scale so that equal percentage changes in real GDP per capita across countries are the same size in the graph.
| Figure 37.1 | Economic Growth in the United States, India, and China over the Past Century |
To give a sense of how much the U.S. economy grew during the last century, Table 37.1 shows real GDP per capita at 20-
Table 37.1U.S. Real GDP per Capita
| Year | Percentage of 1910 real GDP per capita | Percentage of 2010 real GDP per capita |
| 1910 | 100% | 16% |
| 1930 | 125 | 20 |
| 1950 | 192 | 31 |
| 1970 | 302 | 49 |
| 1990 | 467 | 76 |
| 2010 | 614 | 100 |
Source: Angus Maddison, January 2003; J. Bolt and J. L. van Zanden, “The First Update of the Maddison Project; Re-
The income of the typical family normally grows more or less in proportion to per capita income. For example, a 1% increase in real GDP per capita corresponds, roughly, to a 1% increase in the income of the median or typical family—
Yet many people in the world have a standard of living equal to or lower than that of the United States a century ago. That’s the message about China and India in Figure 37.1: despite dramatic economic growth in China over the last three decades and the less dramatic acceleration of economic growth in India, China has only recently attained the standard of living that the United States enjoyed in 1910, while India is still poorer than the United States was in 1910. And much of the world today is poorer than China or India.
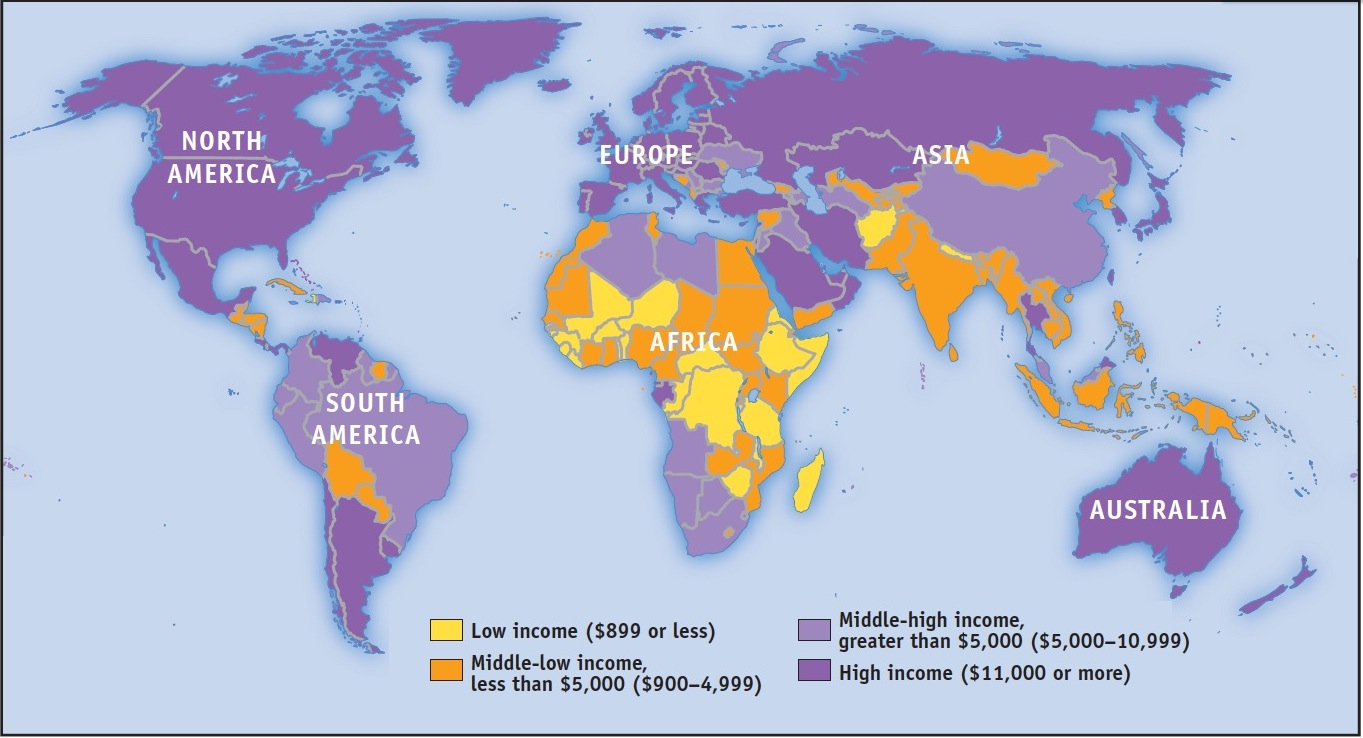
You can get a sense of how poor much of the world remains by looking at Figure 37.2, a map of the world in which countries are classified according to their 2013 levels of GDP per capita, in U.S. dollars. As you can see, large parts of the world have very low incomes. Generally speaking, the countries of Europe and North America, as well as a few in the Pacific, have high incomes. The rest of the world, containing most of its population, is dominated by countries with GDP less than $7,000 per capita—
| Figure 37.2 | Incomes Around the World, 2013 |
When Did Long-Run Growth Begin?

In 2013, the United States was much richer than it was in 1953; in 1953, it was much richer than it had been in 1903. But how did 1853 compare with 1803? Or 1753? How far back does long-
The answer is that long-
Growth Rates
How did the United States manage to produce nearly seven times more per person in 2010 than in 1910? A little bit at a time. Long-
India Takes Off
India Takes Off
India achieved independence from Great Britain in 1947, becoming the world’s most populous democracy—
Since then, however, India has done much better. As Figure 37.3 shows, real GDP per capita has grown at an average rate of 3% a year, tripling between 1980 and 2013. India now has a large and rapidly growing middle class. And yes, the well-
What went right in India after 1980? Many economists point to policy reforms. For decades after independence, India had a tightly controlled, highly regulated economy. Today, things are very different: a series of reforms opened the economy to international trade and freed up domestic competition. Some economists, however, argue that this can’t be the main story because the big policy reforms weren’t adopted until 1991, yet growth accelerated around 1980.
Regardless of the explanation, India’s economic rise has transformed it into a major new economic power—

The Rule of 70 tells us that the time it takes a variable that grows gradually over time to double is approximately 70 divided by that variable’s annual growth rate.
To have a sense of the relationship between the annual growth rate of real GDP per capita and the long-
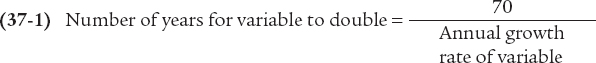
(Note that the Rule of 70 can only be applied to a positive growth rate.) So if real GDP per capita grows at 1% per year, it will take 70 years to double. If it grows at 2% per year, it will take only 35 years to double. Applying the Rule of 70 to the 2.1% average growth rate in the United States implies that it should have taken 33.3 years for real GDP per capita to double; it would have taken 100 years—
Figure 37.3 shows the average annual rate of growth of real GDP per capita for selected countries from 1980 to 2012. Some countries were notable success stories: we’ve already mentioned China, which has made spectacular progress. India, although not matching China’s performance, has also achieved impressive growth.
| Figure 37.3 | Comparing Recent Growth Rates |
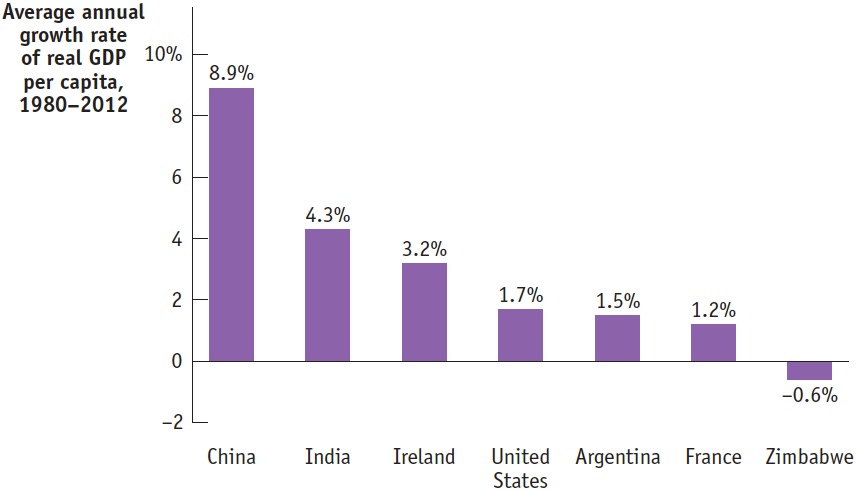
Some countries, though, have had very disappointing growth. This includes many of the countries in Africa and South America, where growth rates below 1% are common. A few countries, such as Zimbabwe, have actually slid backward.
What explains these differences in growth rates? To answer that question, we need to examine the sources of long-