Tackle the Test: Free-Response Questions
Question
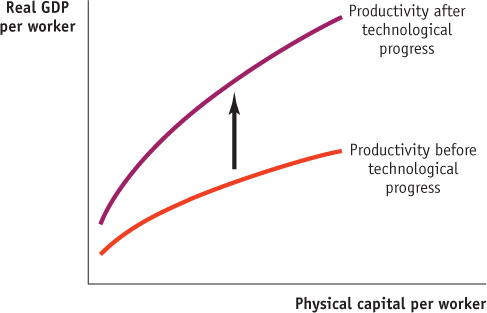
A productivity curve is a graphical representation of an aggregate production function.
Draw a correctly labeled graph of a productivity curve that illustrates diminishing returns to physical capital.
Explain what it is about your productivity curve that indicates that there are diminishing returns to physical capital.
On your graph, illustrate the effect of technological progress.
How is the level of human capital per worker addressed on your graph?
Rubric for FRQ 1 (7 points)
1 point: Vertical axis is labeled “Real GDP per worker.”
1 point: Horizontal axis is labeled “Physical capital per worker.”
1 point: Upward-
sloping curve is labeled “Aggregate production function” or “Productivity.” 1 point: Curve increases at a decreasing rate (the slope is positive and decreasing).
1 point: Equal increases in physical capital per worker lead to smaller increases in real GDP per worker.
1 point: Upward shift of production function is labeled to indicate technological progress.
1 point: Human capital per worker is held constant.
Question
Croatia is a small country in Eastern Europe.
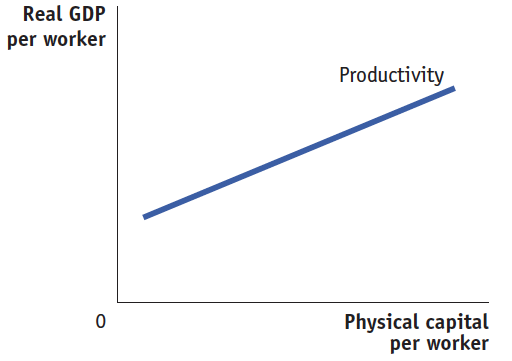
Suppose that in Croatia each successive increase in the amount of physical capital per worker leads to the same increase in productivity. Use a correctly labeled graph to show what Croatia’s productivity curve would look like.
Suppose instead that each successive increase in the amount of physical capital per worker leads to a larger increase in productivity. Use a correctly labeled graph to show what Croatia’s productivity curve would look like.
Between 1991 and 1995, Croatia fought a war for independence from Yugoslavia. This war destroyed a significant portion of the physical capital in Croatia. Supposing all other things remained unchanged, explain how the effect of this change would be illustrated on your graph from part a.
After the war, Croatia invested in education that increased each worker’s ability to make productive use of any given amount of capital. Explain how this affected Croatia’s productivity curve. (5 points)
Rubric for FRQ 2 (5 points)
1 point: Graph with “Real GDP per worker” on the vertical axis and “Physical capital per worker” on the horizontal axis
1 point: Straight, upward-sloping productivity curve shown on graph
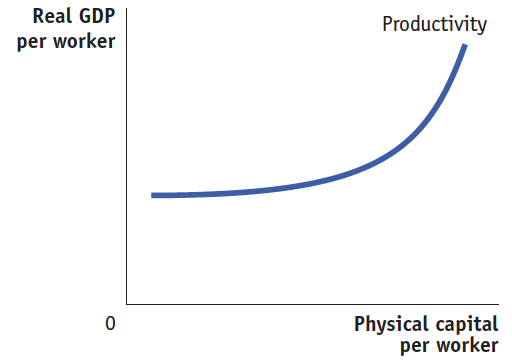
1 point: Graph with curve that increases at an increasing rate
1 point: Movement would occur to the left along the same productivity curve to indicate a decrease in the amount of physical capital per worker.
1 point: It shifted the productivity curve upward, because the real GDP per capita increased for any given amount of capital.