Tackle the Test: Multiple-Choice Questions
Refer to the graph above to answer the following questions.
Question
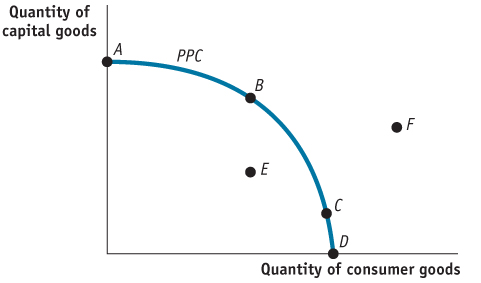
Which point(s) on the graph represent productive efficiency?
A. B. C. D. E. Which point(s) on the graph represent productive efficiency?Question
For this economy, an increase in the quantity of capital goods produced without a corresponding decrease in the quantity of consumer goods produced
A. B. C. D. E. For this economy, an increase in the quantity of capital goods produced without a corresponding decrease in the quantity of consumer goods producedQuestion
An increase in unemployment could be represented by a movement from point
A. B. C. D. E. An increase in unemployment could be represented by a movement from pointQuestion
Which of the following might allow this economy to move from point B to point F?
A. B. C. D. E. Question
This production possibilities curve shows the trade-
off between consumer goods and capital goods. Since capital goods are a resource, an increase in the production of capital goods today will increase the economy’s production possibilities in the future. Therefore, all other things equal (ceteris paribus), producing at which point today will result in the largest outward shift of the PPC in the future? A. B. C. D. E.