Tackle the Test: Free-Response Questions
Question
Refer to the graph below. Assume that the country is producing at point C.
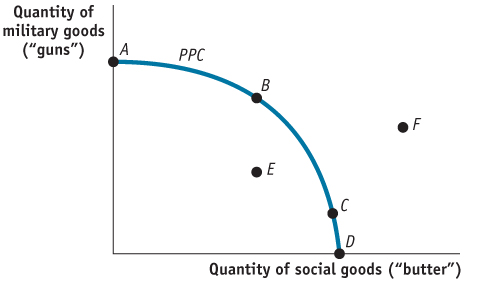
Does this country’s production possibilities curve exhibit increasing opportunity costs? Explain.
If this country were to go to war, the most likely move would be from point C to which point? Explain.
If the economy entered into a recession, the country would move from point C to which point? Explain.
Rubric for FRQ 1 (6 points)
1 point: Yes
1 point: The PPC is concave (bowed outward), so with each additional unit of butter produced, the opportunity cost in terms of gun production (indicated by the slope of the line) increases. Likewise, as more guns are produced, the opportunity cost in terms of butter increases.
1 point: B
1 point: The country would choose an efficient point with more (but not all) military goods with which to fight the war. Point A would be an unlikely choice because at that point there is no production of any social goods, some of which are needed to maintain a minimal standard of living.
1 point: E
1 point: A recession, which causes unemployment, is represented by a point below the PPC.
Question
Assume that an economy can choose between producing food and producing shelter at a constant opportunity cost. Draw a correctly labeled production possibilities curve for the economy. On your graph:
Use the letter E to label one of the points that is productively efficient.
Use the letter U to label one of the points at which there might be unemployment.
Use the letter I to label one of the points that is not feasible.
(5 points)
Assume that an economy can choose between producing food and producing shelter at a constant opportunity cost. Draw a correctly labeled production possibilities curve for the economy. On your graph:Rubric for FRQ 2 (5 points)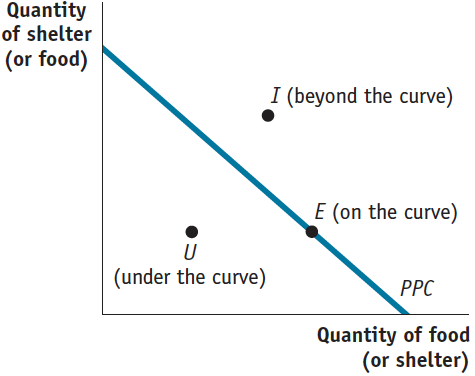
1 point: The graph has “Quantity of shelter” and “Quantity of food” labeled on the axes.
1 point: The production possibilities curve is a downward-sloping, straight line.
1 point: E is labeled on the production possibilities curve.
1 point: U is labeled below the production possibilities curve.
1 point: I is labeled beyond the production possibilities curve.