Tackle the Test: Free-Response Questions
Question
Refer to the graph provided.
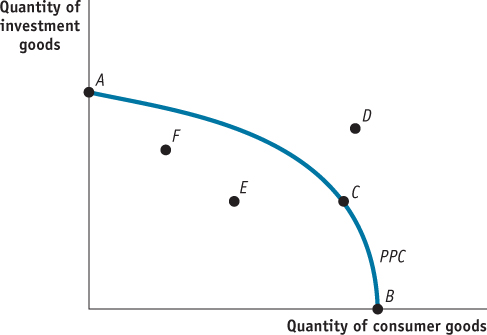
Which point(s) could represent a downturn in the business cycle?
Which point(s) represent efficient production?
Which point(s) are attainable only after long-
run economic growth? How would long-
run economic growth be represented on this graph? Policy that results in an increase in the production of consumer goods without reducing the production of investment goods is represented by a movement from point _________ to point _________.
Producing at which efficient point this year would lead to the most economic growth next year?
Rubric for FRQ 1 (9 points)
2 points: A downturn could be represented by points E or F.
3 points: Points A, B, and C represent efficient production.
1 point: Point D is attainable only after long-
run economic growth. 1 point: Long-
run economic growth would be represented by an outward shift of the curve. 1 point: Consumer goods increase and investment goods remain unchanged when moving from point E to point C.
1 point: Producing at point A would lead to the most economic growth.
Question
Draw a separate, correctly labeled aggregate demand and supply graph to illustrate each of the following situations. On each of your graphs, include the relevant short-
run aggregate supply curve(s), long- run aggregate supply curve(s), and aggregate demand curve(s). Expansionary fiscal policy moves the economy out of a recession.
Investment in infrastructure by the government leads to long-
run economic growth.(6 points)
Rubric for FRQ 2 (6 points)
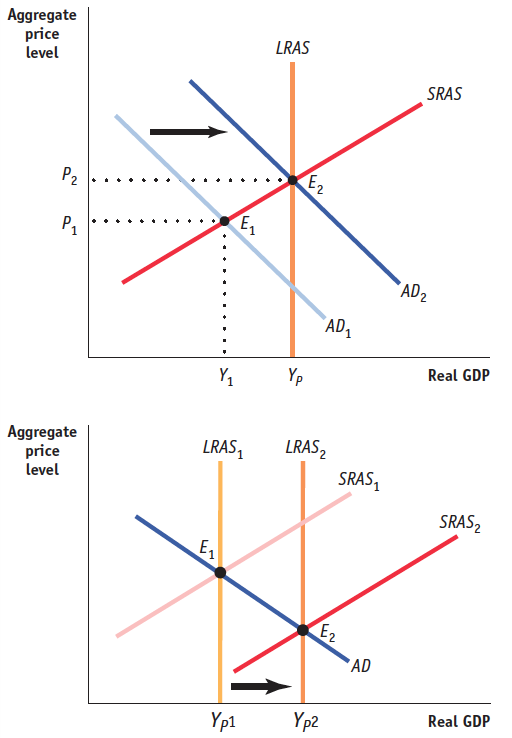
1 point: Vertical axis labeled “Aggregate price level” or “ PL ” and horizontal axis labeled “Real GDP”
1 point: Downward-sloping AD and upwardsloping SRAS
1 point: Vertical LRAS to the right of the initial equilibrium of AD and SRAS
1 point: AD shifts rightward.
1 point: 2nd graph with correctly labeled initial equilibrium of AD , SRAS , and LRAS
1 point: Shift of LRAS and SRAS to the right (but it is not necessary to show a new long-run equilibrium of SRAS and AD )