Capital Flows and the Balance of Payments
In 2012, people living in the United States sold about $3.5 trillion worth of stuff to people living in other countries and bought about $3.2 trillion worth of stuff in return. What kind of stuff? All kinds. Residents of the United States (including employees of firms operating in the United States) sold airplanes, bonds, wheat, and many other items to residents of other countries. Residents of the United States bought cars, stocks, oil, and many other items from residents of other countries.
How can we keep track of these transactions? Earlier we learned that economists keep track of the domestic economy using the national income and product accounts. Economists keep track of international transactions using a different but related set of numbers, the balance of payments accounts.
Balance of Payments Accounts
A country’s balance of payments accounts are a summary of the country’s transactions with other countries.
A country’s balance of payments accounts are a summary of the country’s transactions with other countries.

To understand the basic idea behind the balance of payments accounts, let’s consider a small-
They made $100,000 by selling artichokes.
They spent $70,000 on running the farm, including purchases of new farm machinery, and another $40,000 buying food, paying utility bills for their home, replacing their worn-
out car, and so on. - Page 407
They received $500 in interest on their bank account but paid $10,000 in interest on their mortgage.
They took out a new $25,000 loan to help pay for farm improvements but didn’t use all the money immediately. So they put the extra in the bank.
How could we summarize the Costas’ year? One way would be with a table like Table 41.1, which shows sources of cash coming in and money going out, characterized under a few broad headings. The first row of Table 41.1 shows sales and purchases of goods and services: sales of artichokes; purchases of farm machinery, groceries, heating oil, that new car, and so on. The second row shows interest payments: the interest the Costas received from their bank account and the interest they paid on their mortgage. The third row shows cash coming in from new borrowing versus money deposited in the bank.
Table 41.1The Costas’ Financial Year
| Sources of cash | Uses of cash | Net | |
| Purchases or sales of goods and services | Artichoke sales: $100,000 | Farm operation and living expenses: $110,000 | −$10,000 |
| Interest payments | Interest received on bank account: $500 | Interest paid on mortgage: $10,000 | −$9,500 |
| Loans and deposits | Funds received from new loan: $25,000 | Funds deposited in bank: $5,500 | +$19,500 |
| Total | $125,500 | $125,500 | $0 |
In each row we show the net inflow of cash from that type of transaction. So the net in the first row is −$10,000 because the Costas spent $10,000 more than they earned. The net in the second row is −$9,500, the difference between the interest the Costas received on their bank account and the interest they paid on the mortgage. The net in the third row is $19,500: the Costas brought in $25,000 with their new loan but put only $5,500 of that sum in the bank.
The last row shows the sum of cash coming in from all sources and the sum of all cash used. These sums are equal, by definition: every dollar has a source, and every dollar received gets used somewhere. (What if the Costas hid money under the mattress? Then that would be counted as another “use” of cash.)
A country’s balance of payments accounts summarize its transactions with the world using a table similar to the one we just used to summarize the Costas’ financial year.

AP® Exam Tip
Remember that the current account includes goods and services and cash transfers such as foreign aid, gifts, and grants. You may be asked to identify these transactions on the AP® exam.
Table 41.2 shows a simplified version of the U.S. balance of payments accounts for 2012. Where the Costa family’s accounts show sources and uses of cash, the balance of payments accounts show payments from foreigners—
Table 41.2The U.S. Balance of Payments in 2012 (billions of dollars)
| Payments from foreigners | Payments to foreigners | Net | |
| 1 Sales and purchases of goods and services | $2,211 | $2,745 | −$534 |
| 2 Factor income | 776 | 552 | 224 |
| 3 Transfers | — | — | −130 |
| Current account (1 + 2 + 3) | −440 | ||
| 4 Official asset sales and purchases | 394 | −81 | 475 |
| 5 Private sales and purchases of assets | 150 | 178 | −28 |
| Financial account (4 + 5) | 447 | ||
| Total | — | — | 7 |
| Source: Bureau of Economic Analysis. | |||
Row 1 of Table 41.2 shows payments that arise from sales and purchases of goods and services. For example, the value of U.S. wheat exports and the fees foreigners pay to U.S. consulting companies appear in the second column of row 1; the value of U.S. oil imports and the fees American companies pay to Indian call centers—
Row 2 shows factor income—payments for the use of factors of production owned by residents of other countries. Mostly this means investment income: interest paid on loans from overseas, the profits of foreign-
Row 3 shows international transfers—funds sent by residents of one country to residents of another. The main element here is the remittances that immigrants, such as the millions of Mexican-
The next two rows of Table 41.2 show payments resulting from sales and purchases of assets, broken down by who is doing the buying and selling. Row 4 shows transactions that involve governments or government agencies, mainly central banks. As we’ll learn later, in 2012, most of the U.S. sales in this category involved the accumulation of foreign exchange reserves by the central banks of China and oil-
In laying out Table 41.2, we have separated rows 1, 2, and 3 into one group and rows 4 and 5 into another. This reflects a fundamental difference in how these two groups of transactions affect the future.
When a U.S. resident sells a good, such as wheat, to a foreigner, that’s the end of the transaction. But a financial asset, such as a bond, is different. Remember, a bond is a promise to pay interest and principal in the future. So when a U.S. resident sells a bond to a foreigner, that sale creates a liability: the U.S. resident will have to pay interest and repay principal in the future. The balance of payments accounts distinguish between transactions that don’t create liabilities and those that do.
A country’s balance of payments on the current account, or the current account, is its balance of payments on goods and services plus net international transfer payments and factor income.
A country’s balance of payments on goods and services is the difference between the value of its exports and the value of its imports during a given period.
Transactions that don’t create liabilities are considered part of the balance of payments on the current account, often referred to simply as the current account: the balance of payments on goods and services plus factor income and net international transfer payments. The balance of row 1 of Table 41.2, -$534 billion, corresponds to the most important part of the current account: the balance of payments on goods and services, the difference between the value of exports and the value of imports during a given period.
The merchandise trade balance, or trade balance, is the difference between a country’s exports and imports of goods.
By the way, if you read news reports on the economy, you may well see references to another measure, the merchandise trade balance, sometimes referred to as the trade balance for short. This is the difference between a country’s exports and imports of goods alone—
A country’s balance of payments on the financial account, or simply the financial account, is the difference between its sales of assets to foreigners and its purchases of assets from foreigners during a given period.
The current account, as we’ve just learned, consists of international transactions that don’t create liabilities. Transactions that involve the sale or purchase of assets, and therefore do create future liabilities, are considered part of the balance of payments on the financial account, or the financial account for short. (Until a few years ago, economists often referred to the financial account as the capital account. We’ll use the modern term, but you may run across the older term.)
So how does it all add up? The shaded rows of Table 41.2 show the bottom lines: the overall U.S. current account and financial account for 2012. As you can see, in 2012, the United States ran a current account deficit: the amount it paid to foreigners for goods, services, factors, and transfers was greater than the amount it received. Simultaneously, it ran a financial account surplus: the value of the assets it sold to foreigners was greater than the value of the assets it bought from foreigners.
AP® Exam Tip
Remember that the financial account tracks assets such as real estate, stocks, and bonds. Dividends and interest paid are not assets, so they are counted in the current account. You may be asked to identify these transactions on the AP® exam.
In the official data, the U.S. current account deficit and financial account surplus almost, but not quite, offset each other: the financial account surplus was $7 billion larger than the current account deficit. But that’s just a statistical error, reflecting the imperfection of official data. (And a $7 billion error when you’re measuring inflows and outflows of $3.5 trillion isn’t bad!) In fact, it’s a basic rule of balance of payments accounting that the current account and the financial account must sum to zero:
(41-
or
CA = −FA
Why must Equation 41-
| Figure 41.1 | The Balance of Payments |
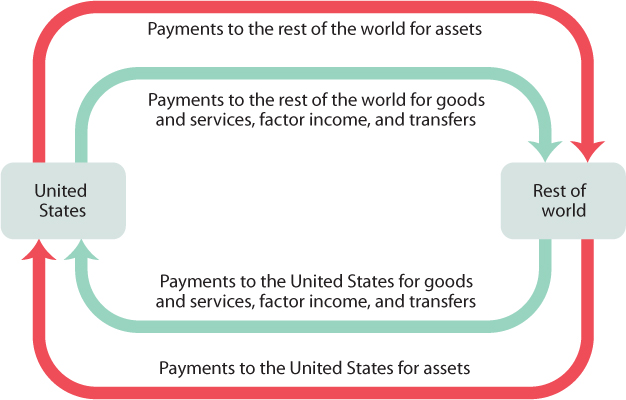
Instead of showing the flow of money within a national economy, Figure 41.1 shows the flow of money between national economies. Money flows into the United States from the rest of the world as payment for U.S. exports of goods and services, as payment for the use of U.S.-owned factors of production, and as transfer payments. These flows (indicated by the lower green arrow) are the positive components of the U.S. current account. Money also flows into the United States from foreigners who purchase U.S. assets (as shown by the lower red arrow)—the positive component of the U.S. financial account.
At the same time, money flows from the United States to the rest of the world as payment for U.S. imports of goods and services, as payment for the use of foreign-
GDP, GNP, and the Current Account
GDP, GNP, and the Current Account
When we discussed national income accounting, we derived the basic equation relating GDP to the components of spending:
Y = C + I + G + X − IM
where X and IM are exports and imports, respectively, of goods and services. But as we’ve learned, the balance of payments on goods and services is only one component of the current account balance. Why doesn’t the national income equation use the current account as a whole?
The answer is that gross domestic product, which is the value of goods and services produced in a country, doesn’t include two sources of income that are included in calculating the current account balance: international factor income and international transfers. The profits of Ford Motors U.K. aren’t included in America’s GDP, and the funds Latin American immigrants send home to their families aren’t subtracted from GDP.
Shouldn’t we have a broader measure that does include these sources of income? Actually, gross national product—
Why do economists use GDP rather than a broader measure? Two reasons. First, the original purpose of the national accounts was to track production rather than income. Second, data on international factor income and transfer payments are generally considered somewhat unreliable. So if you’re trying to keep track of movements in the economy, it makes sense to focus on GDP, which doesn’t rely on these unreliable data.

AP® Exam Tip
The current and financial accounts balance each other out. If there is a surplus in one account, there is a deficit in the other.
(41-
Equation 41-
(41-
Equation 41-
But what determines the current account and the financial account?
Modeling the Financial Account
A country’s financial account measures its net sales of assets, such as currencies, securities, and factories, to foreigners. Those assets are exchanged for a type of capital called financial capital, which is funds from savings that are available for investment spending. So we can think of the financial account as a measure of capital inflows in the form of foreign savings that become available to finance domestic investment spending.
What determines these capital inflows?
Part of our explanation will have to wait for a little while because some international capital flows are created by governments and central banks, which sometimes act very differently from private investors. But we can gain insight into the motivations for capital flows that are the result of private decisions by using the loanable funds model we developed previously. In using this model, we make two important simplifications:
We simplify the reality of international capital flows by assuming that all flows are in the form of loans. In reality, capital flows take many forms, including purchases of shares of stock in foreign companies and foreign real estate as well as foreign direct investment, in which companies build factories or acquire other productive assets abroad.
We also ignore the effects of expected changes in exchange rates, the relative values of different national currencies. We’ll analyze the determination of exchange rates later.
| Figure 41.2 | The Loanable Funds Model Revisited |
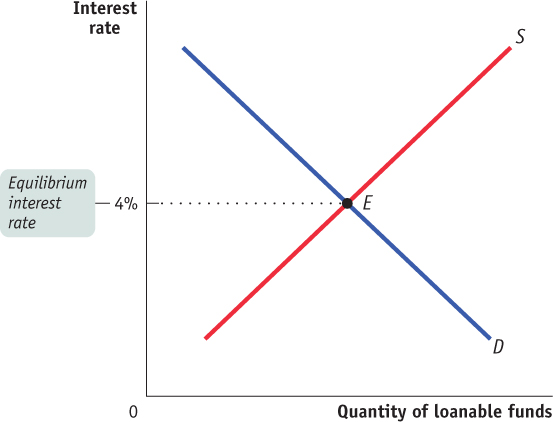
Figure 41.2 recaps the loanable funds model for a closed economy. Equilibrium corresponds to point E, at an interest rate of 4%, at which the supply curve for loanable funds (S) intersects the demand curve for loanable funds (D). If international capital flows are possible, this diagram changes and E may no longer be the equilibrium. We can analyze the causes and effects of international capital flows using Figure 41.3, which places the loanable funds market diagrams for two countries side by side.
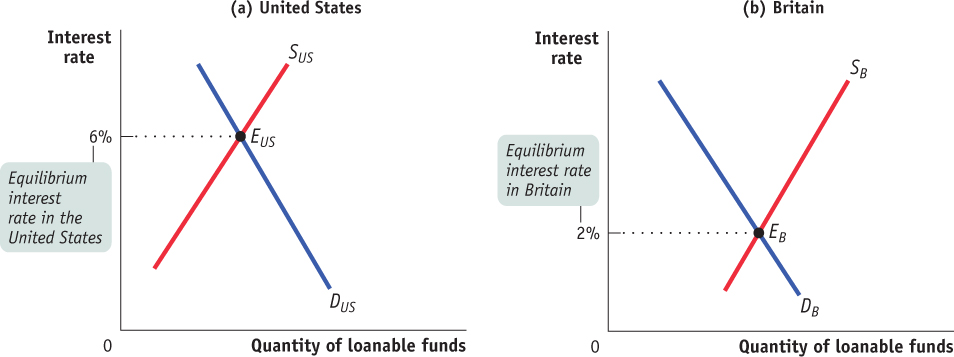
Figure 41.3 illustrates a world consisting of only two countries, the United States and Britain. Panel (a) shows the loanable funds market in the United States, where the equilibrium in the absence of international capital flows is at point EUS with an interest rate of 6%. Panel (b) shows the loanable funds market in Britain, where the equilibrium in the absence of international capital flows is at point EB with an interest rate of 2%.
| Figure 41.3 | Loanable Funds Markets in Two Countries |
AP® Exam Tip
The financial account will have capital inflows and capital outflows based on changes in interest rates. This is financial capital and not capital in the form of machinery and equipment used in the production process.
Will the actual interest rate in the United States remain at 6% and that in Britain at 2%? Not if it is easy for British residents to make loans to Americans. In that case, British lenders, attracted by high U.S. interest rates, will send some of their loanable funds to the United States. This capital inflow will increase the quantity of loanable funds supplied to American borrowers, pushing the U.S. interest rate down. At the same time, it will reduce the quantity of loanable funds supplied to British borrowers, pushing the British interest rate up. So international capital flows will narrow the gap between U.S. and British interest rates.
Let’s further suppose that British lenders regard a loan to an American as being just as good as a loan to one of their own compatriots, and American borrowers regard a debt to a British lender as no more costly than a debt to an American lender. In that case, the flow of funds from Britain to the United States will continue until the gap between their interest rates is eliminated. In other words, international capital flows will equalize the interest rates in the two countries. Figure 41.4 shows an international equilibrium in the loanable funds markets where the equilibrium interest rate is 4% in both the United States and Britain. At this interest rate, the quantity of loanable funds demanded by American borrowers exceeds the quantity of loanable funds supplied by American lenders. This gap is filled by “imported” funds—
| Figure 41.4 | International Capital Flows |
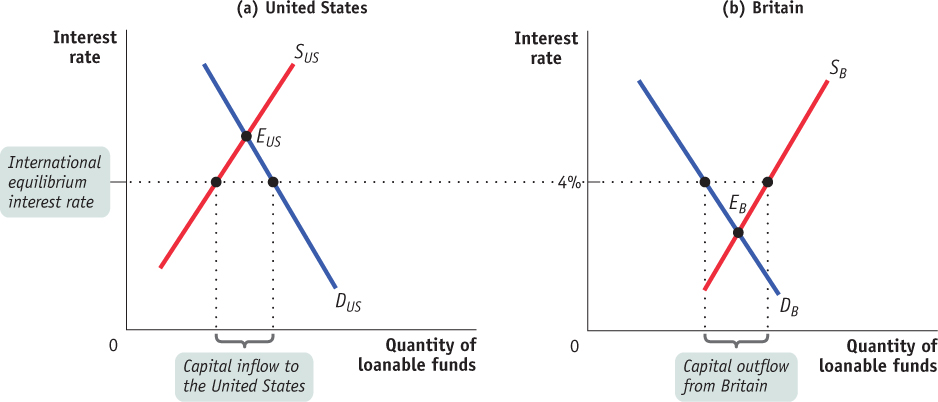
In short, international flows of capital are like international flows of goods and services. Capital moves from places where it would be cheap in the absence of international capital flows to places where it would be expensive in the absence of such flows.
Underlying Determinants of International Capital Flows
The open-
International differences in the demand for funds reflect underlying differences in investment opportunities. In particular, a country with a rapidly growing economy, other things equal, tends to offer more investment opportunities than a country with a slowly growing economy. So a rapidly growing economy typically—
A Global Savings Glut?
A Global Savings Glut?
In the early years of the twenty-
In an influential speech early in 2005, Ben Bernanke—
What caused this global savings glut? According to Bernanke, the main cause was the series of financial crises that began in Thailand in 1997, ricocheted across much of Asia, and then hit Russia in 1998, Brazil in 1999, and Argentina in 2002. The ensuing fear and economic devastation led to a fall in investment spending and a rise in savings in many relatively poor countries. As a result, a number of these countries, which had previously been the recipients of capital inflows from developed countries like the United States, began experiencing large capital outflows. For the most part, the capital flowed to the United States, perhaps because “the depth and sophistication of the country’s financial markets” made it an attractive destination.
When Bernanke gave his speech, it was viewed as reassuring: basically, he argued that the United States was responding in a sensible way to the availability of cheap money in world financial markets. Later, however, it would become clear that the cheap money from abroad helped fuel a housing bubble, which caused widespread financial and economic damage when it burst.
The classic example is the flow of capital from Britain to the United States, among other countries, between 1870 and 1914. During that era, the U.S. economy was growing rapidly as the population increased and spread westward, and as the nation industrialized. This created a demand for investment spending on railroads, factories, and so on. Meanwhile, Britain had a much more slowly growing population, was already industrialized, and already had a railroad network covering the country. This left Britain with savings to spare, much of which were lent to the United States and other New World economies.
International differences in the supply of funds reflect differences in savings across countries. These may be the result of differences in private savings rates, which vary widely among countries. For example, in 2013, private savings were 27.1% of Japan’s GDP but only 15.9% of U.S. GDP. They may also reflect differences in savings by governments. In particular, government budget deficits, which reduce overall national savings, can lead to capital inflows.
Two-Way Capital Flows
The loanable funds model helps us understand the direction of net capital flows—
The answer to this question is that in the real world, as opposed to the simple model we’ve just constructed, there are other motives for international capital flows besides seeking a higher rate of interest. Individual investors often seek to diversify against risk by buying stocks in a number of countries. Stocks in Europe may do well when stocks in the United States do badly, or vice versa, so investors in Europe try to reduce their risk by buying some U.S. stocks, even as investors in the United States try to reduce their risk by buying some European stocks. The result is capital flows in both directions. Meanwhile, corporations often engage in international investment as part of their business strategy—

Finally, some countries, including the United States, are international banking centers: people from all over the world put money in U.S. financial institutions, which then invest many of those funds overseas.
The result of these two-