Tackle the Test: Free-Response Questions
Question
Draw a correctly labeled graph of the foreign exchange market showing the effect on the equilibrium exchange rate between the U.S. and Japan (the number of yen per U.S. dollar) if capital flows from Japan to the United States decrease due to a change in the preferences of Japanese investors. Has the U.S. dollar appreciated or depreciated?
Rubric for FRQ 1 (7 points)
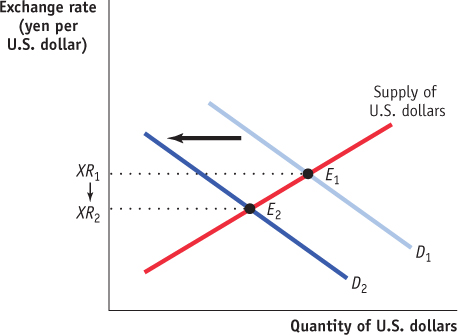
1 point: The vertical axis is labeled “Exchange rate (yen per U.S. dollar)” and the horizontal axis is labeled “Quantity of U.S. dollars.”
1 point: The supply of U.S. dollars is labeled and slopes upward.
1 point: The demand for U.S. dollars is labeled and slopes downward.
1 point: The initial equilibrium exchange rate is found at the intersection of the initial supply and demand curves and is labeled on the vertical axis.
1 point: The new demand for U.S. dollars is to the left of the initial demand.
1 point: The new equilibrium exchange rate is found where the initial supply curve and new demand curve intersect and is labeled on the vertical axis.
1 point: The U.S. dollar has depreciated.
Question
Use a correctly labeled graph of the foreign exchange market between the United States and Europe to illustrate what would happen to the value of the U.S. dollar if there were an increase in the U.S. demand for imports from Europe. Explain your answer. (6 points)
Rubric for FRQ 2 (6 points)
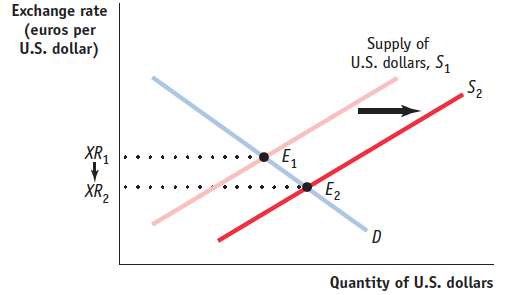
1 point: The vertical axis is labeled “Exchange rate (euros per U.S. dollar)” and the horizontal axis is labeled “Quantity of U.S. dollars.”
1 point: The supply curve is labeled and slopes upward, and the demand curve is labeled and slopes downward.
1 point: The initial equilibrium exchange rate is found at the intersection of the initial supply and demand curves and is labeled on the vertical axis.
1 point: The new supply curve for U.S. dollars occurs to the right of the initial supply curve.
1 point: The new equilibrium exchange rate is found where the initial demand curve and new supply curve intersect and is shown on the vertical axis.
1 point: In order to purchase more imports from Europe, U.S. consumers must supply more dollars in exchange for euros. The increase in the supply of dollars shifts the dollar supply curve to the right and decreases the exchange rate from XR1 to XR2.