Tackle the Test: Free-Response Questions
Question
Suppose the United States and India were the only two countries in the world.
Draw a correctly labeled graph of the foreign exchange market for U.S. dollars showing the equilibrium in the market.
On your graph, indicate a fixed exchange rate set above the equilibrium exchange rate. Does the fixed exchange rate lead to a surplus or shortage of U.S. dollars? Explain and show the amount of the surplus/shortage on your graph.
To bring the foreign exchange market back to an equilibrium at the fixed exchange rate, would the U.S. government need to buy or sell dollars? On your graph, illustrate how the government’s buying or selling of dollars would bring the equilibrium exchange rate back to the desired fixed rate.
Rubric for FRQ 1 (9 points)
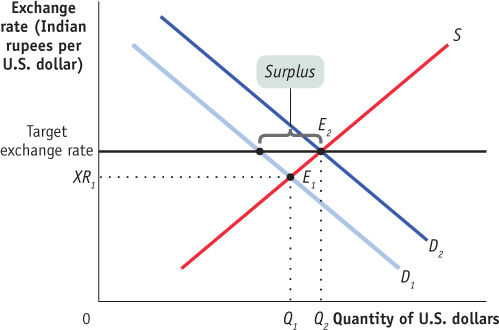
1 point: The vertical axis is labeled “Exchange rate (Indian rupees per U.S. dollar)” and the horizontal axis is labeled “Quantity of U.S. dollars.”
1 point: Demand is downward-
sloping and labeled, supply is upward- sloping and labeled. 1 point: The equilibrium exchange rate and the equilibrium quantity of dollars are labeled on the axes at the point where the supply and demand curves intersect.
1 point: The fixed exchange rate level is depicted above the equilibrium exchange rate.
1 point: Surplus
1 point: The quantity supplied exceeds the quantity demanded at the higher fixed exchange rate.
1 point: The surplus is labeled as the horizontal distance between the supply and demand curves at the fixed exchange rate.
1 point: Buy
1 point: The new demand curve is shown to the right of the old demand curve, crossing the supply curve at the fixed exchange rate.
Question
Suppose the United States and Australia were the only two countries in the world, and that both countries pursued a floating exchange rate regime. Note that the currency in Australia is the Australian dollar.
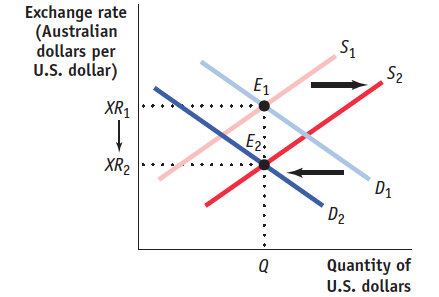
Draw a correctly labeled graph showing equilibrium in the foreign exchange market for U.S. dollars.
If the Federal Reserve pursues expansionary monetary policy, what will happen to the U.S. interest rate and international capital flows? Explain.
On your graph of the foreign exchange market, illustrate the effect of the Fed’s policy on the supply of U.S. dollars, the demand for U.S. dollars, and the equilibrium exchange rate.
How does the Fed’s monetary policy affect U.S. aggregate demand? Explain. (10 points)
Rubric for FRQ 2 (10 points)
1 point: The vertical axis is labeled “Exchange rate (Australian dollars per U.S. dollar)” and the horizontal axis is labeled “Quantity of U.S. dollars.”
1 point: Demand is downward-sloping and labeled; supply is upward-sloping and labeled.
1 point: The equilibrium exchange rate and equilibrium quantity of dollars are labeled on the axes at the point where the supply and demand curves intersect.
1 point: The U.S. interest rate falls.
1 point: There are an increase in the capital flow into Australia and an increase in the capital flow out of the United States.
1 point: The lower interest rate in the United States reduces the incentive to invest in the United States and increases the incentive to invest in Australia.
1 point: The supply of U.S. dollars increases.
1 point: The demand for U.S. dollars decreases.
1 point: The exchange rate falls (the U.S. dollar depreciates).
1 point: The lower exchange rate leads to more exports from the United States to Australia (they are cheaper now) and fewer imports into the United States from Australia (they are more expensive now). When exports increase and imports decrease, U.S. aggregate demand increases.