Tackle the Test: Free-Response Questions
Question
Suppose the U.S. economy is experiencing a recession.
Draw a correctly labeled aggregate demand–
aggregate supply graph showing the aggregate demand, short- run aggregate supply, long- run aggregate supply, equilibrium output, and aggregate price level. Assume that energy prices increase in the United States. Show the effects of this increase on the equilibrium in your graph from part a.
According to your graph, how does the increase in energy prices affect unemployment and inflation in the economy?
Assume the United States and Canada are the only two countries in an open economy and that energy prices have remained unchanged in Canada. Draw a correctly labeled graph of the foreign exchange market for U.S. dollars, and use it to show the effect of increased U.S. energy prices on the demand for U.S. dollars. Explain.
Rubric for FRQ 1 (12 points)
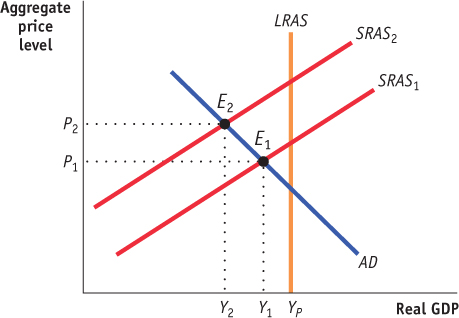
1 point: The vertical axis is labeled “Aggregate price level” and the horizontal axis is labeled “Aggregate output” or “Real GDP.”
1 point: The AD curve slopes downward, the SRAS curve slopes upward, and the LRAS curve is vertical.
Page 4531 point: The equilibrium is found where the SRAS curve crosses the AD curve, and the equilibrium aggregate price level and aggregate output are shown on the axes at this point.
1 point: The equilibrium is to the left of the LRAS curve.
1 point: The SRAS curve shifts to the left.
1 point: The equilibrium aggregate price level and output are shown on the axes at the new equilibrium (increased aggregate price level, decreased aggregate output).
1 point: It increases unemployment.
1 point: It increases the aggregate price level (inflation).
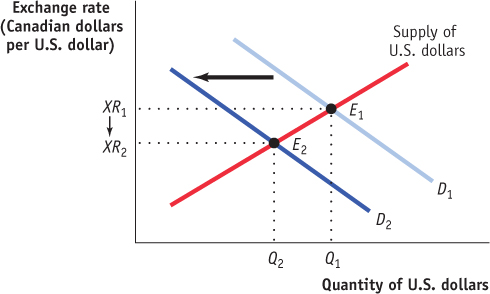
1 point: The vertical axis is labeled “Exchange rate (Canadian dollars per U.S. dollar),” and the horizontal axis is labeled “Quantity of U.S. dollars.” Demand for U.S. dollars slopes downward and is labeled; supply of U.S. dollars slopes upward and is labeled.
1 point: The equilibrium exchange rate and quantity of U.S. dollars are shown on the axes at the intersection of the demand and supply curves.
1 point: The demand for U.S. dollars will decrease.
1 point: The inflation in the United States will lead to a decrease in the demand for U.S. exports (which must be purchased with U.S. dollars).
Question
Assume the United States is operating below potential output.
Draw a correctly labeled aggregate demand–
aggregate supply graph showing equilibrium in the economy. Suppose the government decreases taxes. On your graph, show how the decrease in taxes will affect AD, SRAS, LRAS, equilibrium aggregate price level, and output.
Assume the decrease in taxes led to an increased budget deficit and that the deficit spending was funded through government borrowing from the public. Use a correctly labeled graph of the market for loanable funds to show the effect of increased borrowing on the interest rate.
Given the effect on the interest rate from part c, draw a correctly labeled graph of the foreign exchange market showing the effect of the change in the interest rate on the supply of U.S. dollars. Explain how the interest rate affects the supply of U.S. dollars.
According to your graph from part d, what has happened to the value of the U.S. dollar? How will this affect U.S. exports and aggregate demand? (12 points)
Rubric for FRQ 2 (12 points)
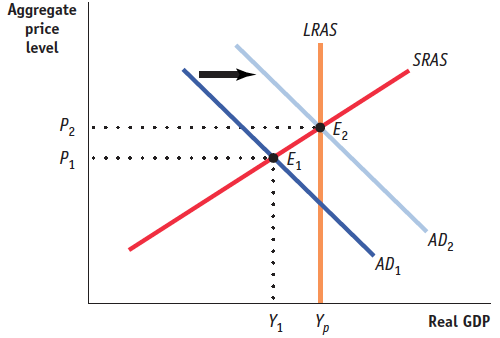
1 point: The vertical axis is labeled “Aggregate price level” or “Price level” and the horizontal axis is labeled “Real GDP.”
1 point: The AD curve is labeled and slopes downward, the SRAS curve is labeled and slopes upward, and the LRAS curve is labeled and vertical at Yp. The equilibrium aggregate price level and aggregate output are shown on the axes where the AD curve and SRAS curve intersect, which is to the left of the LRAS curve.
1 point: A new, labeled AD curve is shown to the right of the original AD curve. The new equilibrium price level and aggregate output are shown on the axes at the new equilibrium point. The new equilibrium does not need to be at potential output.
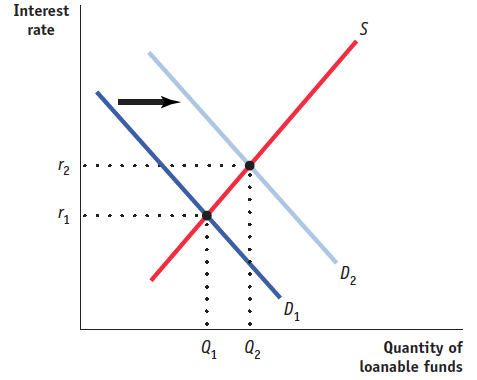
1 point: The vertical axis is labeled “Interest rate” and the horizontal axis is labeled “Quantity of loanable funds.”
1 point: The demand curve is labeled and slopes downward; the supply curve is labeled and slopes upward. The equilibrium interest rate and quantity are shown on the axes at the point where the curves intersect.
1 point: The demand for loanable funds shifts to the right and the new equilibrium values are shown on the axes. The interest rate is higher.
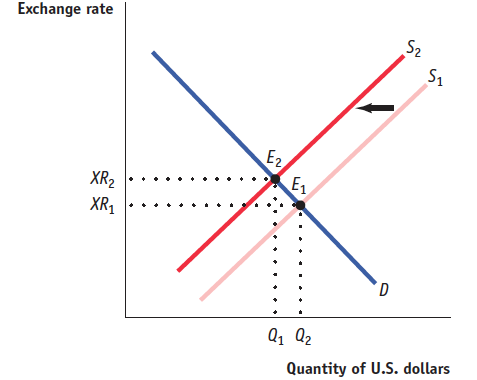
1 point: On the foreign exchange market graph, the vertical axis is labeled “Exchange rate” and the horizontal axis is labeled “Quantity of U.S. dollars.”
1 point: The demand curve slopes downward, the supply curve slopes upward, and the curves are labeled. The equilibrium exchange rate and quantity are shown on the axes at the point where the two curves intersect.
1 point: The supply of U.S dollars decreases, shifting the supply curve to the left.
1 point: This occurs because the higher interest rate in the United States decreases the outflow of capital to countries with a relatively low interest rate.
1 point: The value of the U.S. dollar has increased (it has appreciated).
1 point: Both U.S. exports and aggregate demand will decline.