Tackle the Test: Free-Response Questions
Question
Refer to the table below to answer the following questions.
Price of Good A Quantity of Good A Demanded Quantity of Good B Demanded $10 100 5 8 110 10 Using the midpoint method, calculate the price elasticity of demand for good A.
Give the formula for calculating the cross-
price elasticity of demand between good B and good A. Using the midpoint method, calculate the cross-
price elasticity of demand between good A and good B. What does your answer for part c tell you about the relationship between the two goods? Explain.
Rubric for FRQ 1 (5 points)
1 point: 0.43
1 point: % change in quantity of good B/% change in price of good A or (change in QB/average QB)/(change in PA/average PA)
1 point: −3
1 point: They are complements.
1 point: Cross-
price elasticity is negative— when the price of good A goes down, in addition to buying more of good A, people buy more of good B to go along with it. Question
Assume the price of corn rises by 20% and this causes suppliers to increase the quantity of corn supplied by 40%.
Calculate the price elasticity of supply.
In this case, is supply elastic or inelastic?
Draw a correctly labeled graph of a supply curve illustrating the most extreme case of the category of elasticity you found in part b (either perfectly elastic or perfectly inelastic supply).
What would likely be true of the availability of inputs for a firm with the supply curve you drew in part c? Explain. (5 points)
Rubric for FRQ 2 (5 points)
1 point: 40%/20% = 2
1 point: Elastic
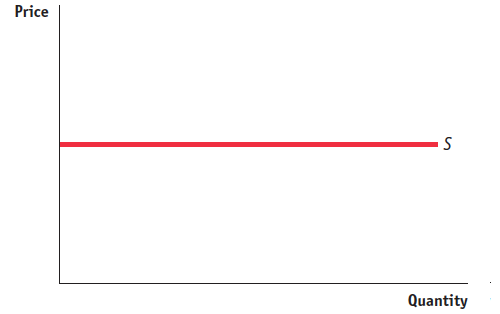
1 point: Horizontal supply curve on correctly labeled graph, as shown in the figure.
1 point: Inputs are readily available.
1 point: When inputs are available to be shifted into or out of production at a low cost, firms can easily expand the quantity of output supplied.