Tackle the Test: Free-Response Questions
Question
Refer to the graph provided.
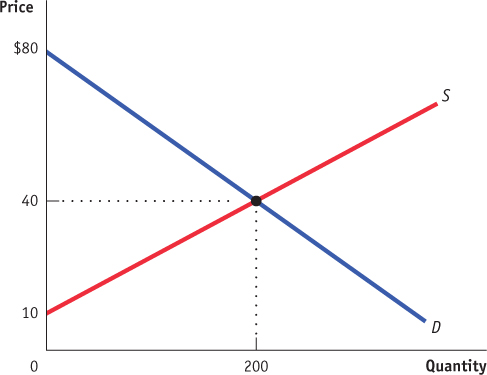
Calculate consumer surplus.
Calculate producer surplus.
If supply increases, what will happen to consumer surplus? Explain.
If demand decreases, what will happen to producer surplus? Explain.
Rubric for FRQ 1 (6 points)
1 point: $4,000
1 point: $3,000
1 point: Consumer surplus will increase.
1 point: An increase in supply lowers the equilibrium price, which causes consumer surplus to increase.
1 point: Producer surplus will decrease.
1 point: A decrease in demand decreases the equilibrium price, which causes producer surplus to decrease.
Question
Draw a correctly labeled graph showing a competitive market in equilibrium. On your graph, clearly indicate and label the area of consumer surplus and the area of producer surplus. (3 points)
Rubric for FRQ 2 (3 points)
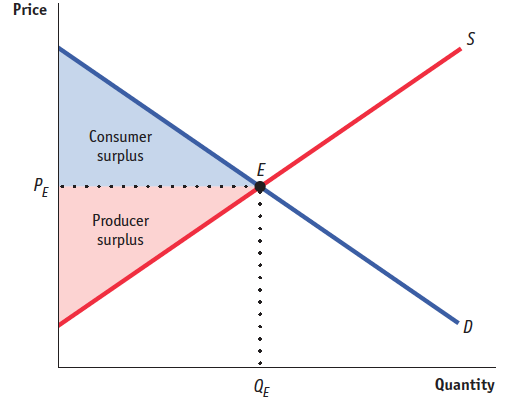
1 point: Graph with vertical axis labeled “Price,” horizontal axis labeled “Quantity,” an upwardsloping supply curve, and a downward-sloping demand curve
1 point: Consumer surplus correctly identified below the demand curve but above the equilibrium price
1 point: Producer surplus correctly identified above the supply curve but below the equilibrium price