The Benefits and Costs of Taxation

When a government is considering whether to impose a tax or how to design a tax system, it has to weigh the benefits of a tax against its costs. We may not think of a tax as something that provides benefits, but governments need money to provide things people want, such as streets, schools, national defense, and health care for those unable to afford it. The benefit of a tax is the revenue it raises for the government to pay for these services. Unfortunately, this benefit comes at a cost—
The Revenue from an Excise Tax
AP® Exam Tip
Be prepared to calculate the revenue earned from a tax. On a graph, this is the area of the rectangle that represents tax revenue. Remember: the area of a rectangle is the width times the height.
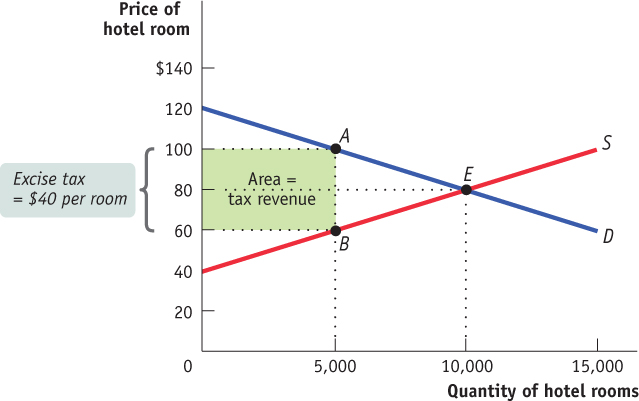
How much revenue does the government collect from an excise tax? In our hotel tax example, the revenue is equal to the area of the shaded rectangle in Figure 50.10.
| Figure 50.10 | The Revenue from an Excise Tax |

To see why this area represents the revenue collected by a $40 tax on hotel rooms, notice that the height of the rectangle is $40, equal to the tax per room. As we've seen, it is also the size of the wedge that the tax drives between the supply price (the price received by producers) and the demand price (the price paid by consumers). Meanwhile, the width of the rectangle is 5,000 rooms, equal to the equilibrium quantity of rooms given the $40 tax. With that information, we can make the following calculations.
The tax revenue collected is:
Tax revenue = $40 per room × 5,000 rooms = $200,000
The area of the shaded rectangle is:
Area = Height × Width = $40 per room × 5,000 rooms = $200,000,
or
Tax revenue = Area of shaded rectangle
This is a general principle: The revenue collected by an excise tax is equal to the area of a rectangle with the height of the tax wedge between the supply price and the demand price and the width of the quantity sold under the tax.
The Costs of Taxation
What is the cost of a tax? You might be inclined to answer that it is the amount of money taxpayers pay to the government—
AP® Exam Tip
It is useful to practice some problems in which letters represent numbers, because you may need to solve problems like that on the AP® exam.
No—
The deadweight loss (from a tax) is the decrease in total surplus resulting from the tax, minus the tax revenues generated.
So an excise tax imposes costs over and above the tax revenue collected in the form of inefficiency, which occurs because the tax discourages mutually beneficial transactions. You may recall from Module 9 that the cost to society of this kind of inefficiency—
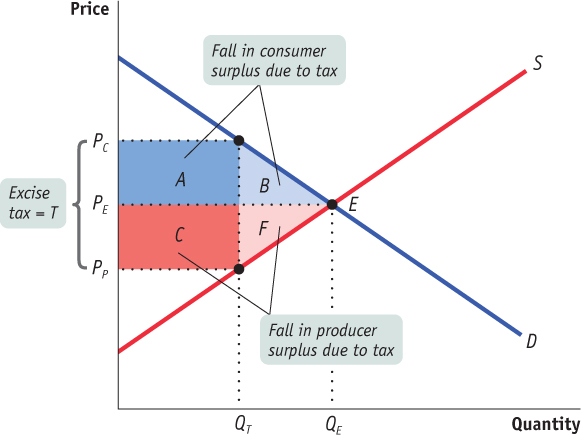
To measure the deadweight loss from a tax, we turn to the concepts of producer and consumer surplus. Figure 50.11 shows the effects of an excise tax on consumer and producer surplus. In the absence of the tax, the equilibrium is at E and the equilibrium price and quantity are PE and QE, respectively. An excise tax drives a wedge equal to the amount of the tax between the price received by producers and the price paid by consumers, reducing the quantity sold. In this case, with a tax of T dollars per unit, the quantity sold falls to QT. The price paid by consumers rises to PC, the demand price of the reduced quantity, QT, and the price received by producers falls to PP, the supply price of that quantity. The difference between these prices, PC – PP, is equal to the excise tax, T.
| Figure 50.11 | A Tax Reduces Consumer and Producer Surplus |

Using the concepts of producer and consumer surplus, we can show exactly how much surplus producers and consumers lose as a result of the tax. We learned previously that a fall in the price of a good generates a gain in consumer surplus that is equal to the sum of the areas of a rectangle and a triangle. Similarly, a price increase causes a loss to consumers that is represented by the sum of the areas of a rectangle and a triangle. So it’s not surprising that in the case of an excise tax, the rise in the price paid by consumers causes a loss equal to the sum of the areas of a rectangle and a triangle: the dark blue rectangle labeled A and the area of the light blue triangle labeled B in Figure 50.11.
Meanwhile, the fall in the price received by producers leads to a fall in producer surplus. This, too, is equal to the sum of the areas of a rectangle and a triangle. The loss in producer surplus is the sum of the areas of the red rectangle labeled C and the pink triangle labeled F in Figure 50.11.
Of course, although consumers and producers are hurt by the tax, the government gains revenue. The revenue the government collects is equal to the tax per unit sold, T, multiplied by the quantity sold, QT. This revenue is equal to the area of a rectangle QT wide and T high. And we already have that rectangle in the figure: it is the sum of rectangles A and C. So the government gains part of what consumers and producers lose from an excise tax.
AP® Exam Tip
Be prepared to calculate the deadweight loss created by a tax. On a graph, deadweight loss is represented by a triangle that points in the direction of the efficient quantity.
But a portion of the loss to producers and consumers from the tax is not offset by a gain to the government—
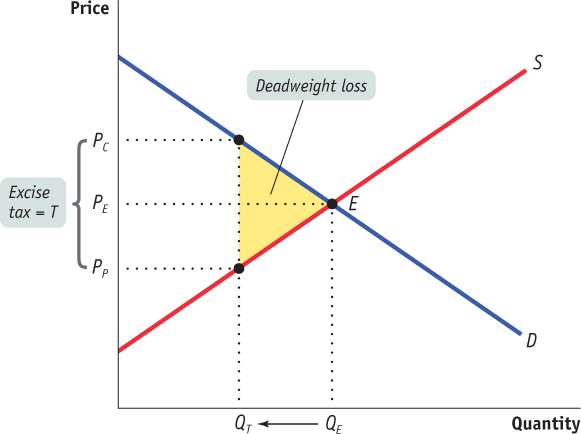
Figure 50.12 is a version of Figure 50.11 that leaves out rectangles A (the surplus shifted from consumers to the government) and C (the surplus shifted from producers to the government) and shows only the deadweight loss, drawn here as a triangle shaded yellow. The base of that triangle is equal to the tax wedge, T; the height of the triangle is equal to the reduction in the quantity transacted due to the tax, QE – QT. Clearly, the larger the tax wedge and the larger the reduction in the quantity transacted, the greater the inefficiency from the tax. But also note an important, contrasting point: if the excise tax somehow didn’t reduce the quantity bought and sold in this market—
| Figure 50.12 | The Deadweight Loss of a Tax |

Using a triangle to measure deadweight loss is a technique used in many economic applications. For example, triangles are used to measure the deadweight loss produced by types of taxes other than excise taxes. They are also used to measure the deadweight loss produced by monopoly, another kind of market distortion. And deadweight-
The administrative costs of a tax are the resources used by the government to collect the tax, and by taxpayers to pay (or to evade) it, over and above the amount collected.
In considering the total amount of inefficiency caused by a tax, we must also take into account something not shown in Figure 50.12: the resources actually used by the government to collect the tax, and by taxpayers to pay it, over and above the amount of the tax. These lost resources are called the administrative costs of the tax. The most familiar administrative cost of the U.S. tax system is the time individuals spend filling out their income tax forms or the money they spend on accountants to prepare their tax forms for them. (The latter is considered an inefficiency from the point of view of society because accountants could instead be performing other, non-
A lump-
Some extreme forms of taxation, such as the poll tax instituted by the government of British Prime Minister Margaret Thatcher in 1989, are notably unfair but very efficient. A poll tax is an example of a lump-
AP® Exam Tip
Unless they cause a firm to shut down, lump-
Under the old system, the highest local taxes were paid by the people with the most expensive houses. Because these people tended to be wealthy, they were also best able to bear the burden. But the old system definitely distorted incentives to engage in mutually beneficial transactions and created deadweight loss. People who were considering home improvements knew that such improvements, by making their property more valuable, would increase their tax bills. The result, surely, was that some home improvements that would have taken place without the tax did not take place because of it. In contrast, a lump-