Tackle the Test: Free-Response Questions
Question
Refer to the graph provided. Assume the government has imposed an excise tax of $60 on producers in this market.
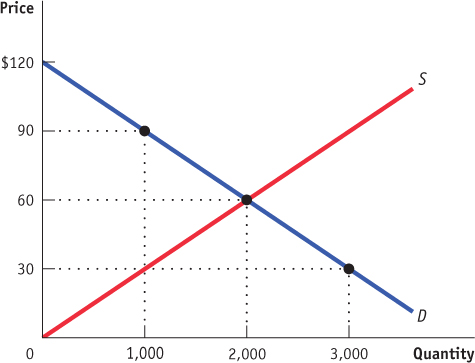
What quantity will be sold in the market?
What price will consumers pay in the market?
By how much will consumer surplus change as a result of the tax?
By how much will producer surplus change as a result of the tax?
How much revenue will the government collect from this excise tax?
Calculate the deadweight loss created by the tax.
Rubric for FRQ 1 (6 points)
1 point: 1,000
1 point: $90
1 point: Consumer surplus will decrease by $45,000, from ½ ($2,000 × 60) = $60,000 before the tax to ½ ($1,000 × 30) = $15,000 after the tax.
1 point: Producer surplus will decrease by $45,000, from ½ ($2,000 × 60) = $60,000 before the tax to ½ ($1,000 × 30) = $15,000 after the tax.
1 point: $60 × 1,000 = $60,000
1 point: ½ × $60 × 1,000 = $30,000
Question
Draw a correctly labeled graph of a competitive market in equilibrium. Use your graph to illustrate the effect of an excise tax imposed on consumers. Indicate each of the following on your graph:
the equilibrium price and quantity without the tax, labeled PE and QE
the quantity sold in the market post-
tax, labeled QT the price paid by consumers post-
tax, labeled PC the price received by producers post-
tax, labeled PP the tax revenue generated by the tax, labeled “Tax revenue”
the deadweight loss resulting from the tax, labeled “DWL” (7 points)
Rubric for FRQ 2 (7 points)
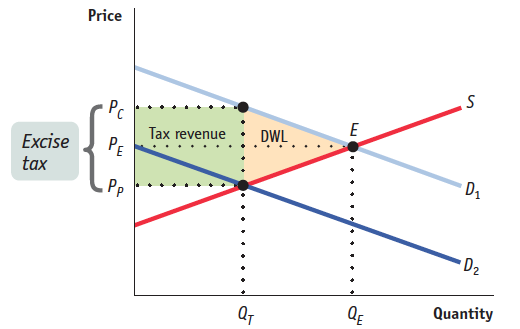
1 point: A graph with “Price” (or P ) on the vertical axis, “Quantity” (or Q ) on the horizontal axis, a downward-sloping demand curve, and an upward-sloping supply curve
1 point: PE and QE labeled along the appropriate axes at the equilibrium levels
1 point: Post-tax quantity labeled QT
1 point: Post-tax consumer price labeled Pc
1 point: Post-tax producer price labeled Pp
1 point: Tax revenue area labeled “Tax revenue”
1 point: Deadweight loss area labeled “DWL”