Utility: It’s All About Getting Satisfaction
When analyzing consumer behavior, we’re looking into how people pursue their needs and wants and the subjective feelings that motivate purchases. Yet there is no simple way to measure subjective feelings. How much satisfaction do I get from my third cookie? Is it less or more than the satisfaction you receive from your third cookie? Does it even make sense to ask that question?
Utility is a measure of personal satisfaction.
Luckily, we don’t need to make comparisons between your feelings and mine. The analysis of consumer behavior that follows requires only the assumption that individuals try to maximize some personal measure of the satisfaction gained from consumption. That measure of satisfaction is known as utility, a concept we use to understand behavior but don’t expect to measure in practice.
Utility and Consumption
We can think of consumers as using consumption to “produce” utility, much in the same way that producers use inputs to produce output. As consumers, we do not make explicit calculations of the utility generated by consumption choices. However, we must make choices, and we usually base them on at least a rough attempt to achieve greater satisfaction. You can have either soup or salad with your dinner. Which would you enjoy more? You can go to Disney World this year or put the money toward buying a new car. Which would make you happier? These are the types of questions that go into utility maximization.
The concept of utility offers a way to study choices that are made in a more or less rational way.
A util is a unit of utility.
How do we measure utility? For the sake of simplicity, it is useful to suppose that we can measure utility in hypothetical units called—
Figure 51.1 illustrates a utility function. It shows the total utility that Cassie, who likes fried clams, gets from an all-
| Figure 51.1 | Cassie’s Total Utility and Marginal Utility |
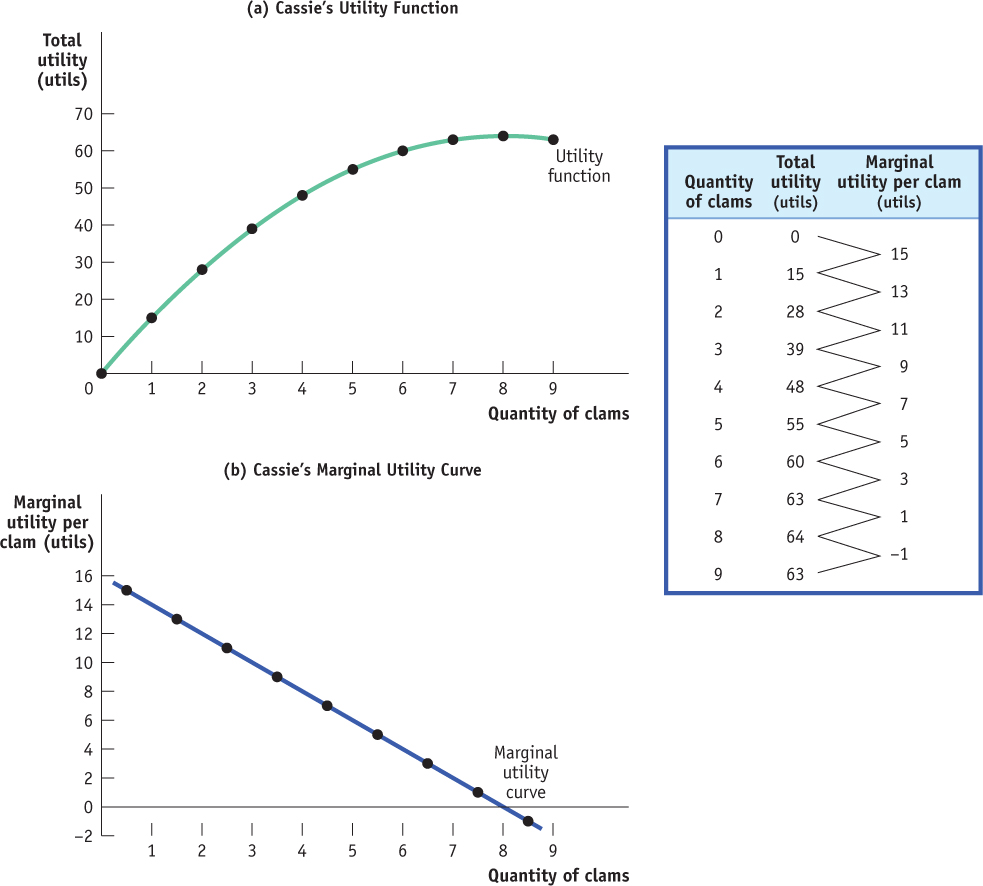
Cassie’s utility function slopes upward over most of the range shown, but it gets flatter as the number of clams consumed increases. And in this example it eventually turns downward. According to the information in the table in Figure 51.1, nine clams is a clam too far. Adding that additional clam actually makes Cassie worse off: it would lower her total utility. If she’s rational, of course, Cassie will realize that and not consume the ninth clam.
So when Cassie chooses how many clams to consume, she will make this decision by considering the change in her total utility from consuming one more clam. This illustrates the general point: to maximize total utility, consumers must focus on marginal utility.
The Principle of Diminishing Marginal Utility
The marginal utility of a good or service is the change in total utility generated by consuming one additional unit of that good or service. The marginal utility curve shows how marginal utility depends on the quantity of a good or service consumed.
In addition to showing how Cassie’s total utility depends on the number of clams she consumes, the table in Figure 51.1 also shows the marginal utility generated by consuming each additional clam—
The marginal utility curve slopes downward because each successive clam adds less to total utility than the previous clam. This is reflected in the table: marginal utility falls from a high of 15 utils for the first clam consumed to –1 for the ninth clam consumed. The fact that the ninth clam has negative marginal utility means that consuming it actually reduces total utility. (Restaurants that offer all-
Is Marginal Utility Really Diminishing?
Is Marginal Utility Really Diminishing?
Are all goods really subject to diminishing marginal utility? Of course not; there are a number of goods for which, at least over some range, marginal utility is surely increasing.
For example, there are goods that require some experience to enjoy. The first time you do it, downhill skiing involves a lot more fear than enjoyment—
Another example would be goods that only deliver positive utility if you buy enough. The great Victorian economist Alfred Marshall, who more or less invented the supply and demand model, gave the example of wallpaper: buying only enough to do half a room is worse than useless. If you need two rolls of wallpaper to finish a room, the marginal utility of the second roll is larger than the marginal utility of the first roll.
So why does it make sense to assume diminishing marginal utility? For one thing, most goods don’t suffer from these qualifications: nobody needs to learn to like ice cream. Also, although most people don’t ski and some people don’t drink coffee, those who do ski or drink coffee do enough of it that the marginal utility of one more ski run or one more cup is less than that of the last. So in the relevant range of consumption, marginal utility is still diminishing.

According to the principle of diminishing marginal utility, each successive unit of a good or service consumed adds less to total utility than does the previous unit.
The basic idea behind the principle of diminishing marginal utility is that the additional satisfaction a consumer gets from one more unit of a good or service declines as the amount of that good or service consumed rises. Or, to put it slightly differently, the more of a good or service you consume, the closer you are to being satiated—
The principle of diminishing marginal utility doesn’t always apply, but it does apply in the great majority of cases, enough to serve as a foundation for our analysis of consumer behavior.