Tackle the Test: Free-Response Questions
Question
Use the data in the table provided.
Quantity Total revenue Total cost 0 $0 $7 1 18 23 2 36 29 3 54 37 4 72 49 5 90 65 6 108 87 7 126 112 What is the marginal revenue of the fourth unit?
Calculate profit at a quantity of two. Explain how you calculated the profit.
What is the profit-
maximizing level of output? Explain how to use the optimal output rule to determine the profit- maximizing level of output.
Rubric for FRQ 1 (5 points)
1 point: $18
1 point: $7
1 point: $36 - $29 or TR - TC
1 point: 5 units
1 point: The optimal output rule states that profit is maximized when MC = MR. Here, MC never exactly equals MR. When this occurs, the firm should produce the largest quantity at which MR exceeds MC. At a quantity of 5, MC = $16 and MR = $18. For the sixth unit, MC = $22 and MR = $18, and because MC > MR, the sixth unit would add more to total cost than it would to total revenue, and it therefore should not be produced.
Question
Use a graph to illustrate the typical shape of the two curves used to find a firm’s profit-
maximizing level of output on the basis of the optimal output rule. Assume all units of output can be sold for $5. Indicate the profit- maximizing level of output with a “Q*” on the appropriate axis. (You don’t have enough information to provide a specific numerical answer.) (3 points) Rubric for FRQ 2 (3 points)
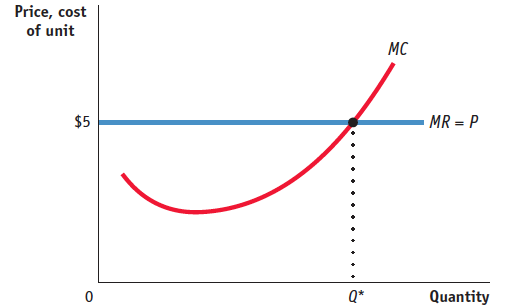
1 point: A graph with a horizontal marginal revenue curve at a height of $5
1 point: A marginal cost curve with a slope that starts out negative and then becomes positive as the quantity increases
1 point: Q* labeled on the horizontal axis below where MR = MC