Tackle the Test: Free-Response Questions
Question
Draw a correctly labeled graph of a production function that exhibits diminishing returns to labor. Assume labor is the variable input and capital is the fixed input. Explain how your graph illustrates diminishing returns to labor.
Rubric for FRQ 1 (4 points)
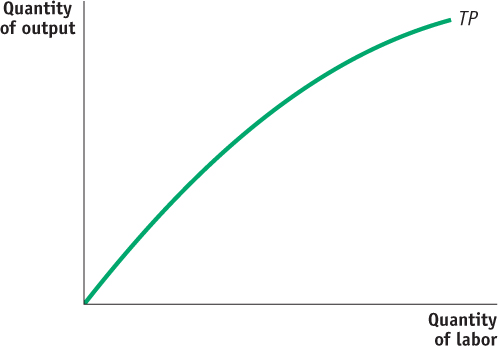
1 point: Graph with vertical axis labeled “Quantity of output” or “Q ” and horizontal axis labeled “Quantity of labor” or “L”
1 point: Upward-
sloping curve labeled “Total product” or “TP ” 1 point: The slope of the total product curve is positive and decreasing.
1 point: Explanation that a positive and decreasing slope illustrates diminishing returns to labor because each additional unit of labor increases total product by less than the previous unit of labor
Question
Use the data in the table below to graph the production function and the marginal product of labor. Do the data illustrate diminishing returns to labor? Explain. (5 points)
Quantity of labor Quantity of output 0 0 1 25 2 47 3 66 4 82 5 95 6 105 7 112 8 116 Rubric for FRQ 2 (5 points)
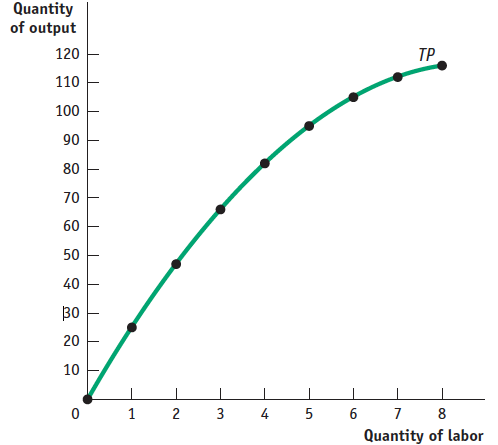
1 point: A graph with the vertical axis labeled “Quantity of output” or “ Q ” and the horizontal axis labeled “Quantity of labor” or “ L ”
1 point: An upward-sloping curve labeled “Total product” or “ TP ,” with the points as shown in the graph that accompanies this answer
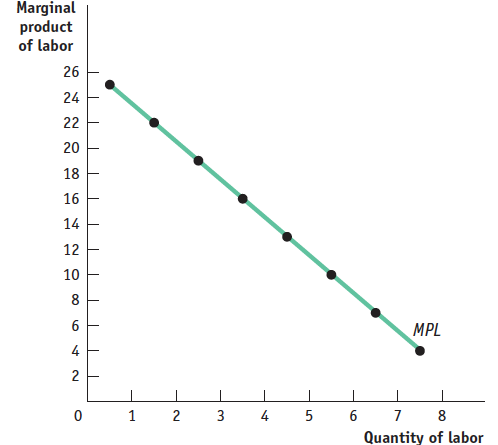
1 point: A second graph with the vertical axis labeled “Marginal product of labor” or “ MPL ” and the horizontal axis labeled “Quantity of labor” or “ L ”
1 point: A downward-sloping curve labeled “Marginal product” or “ MPL ,” as shown in the graph that accompanies this answer
1 point: An explanation that the data illustrate diminishing returns to labor because each additional unit of labor increases total product by less than the previous unit of labor, resulting in a downward-sloping marginal product curve