Tackle the Test: Free-Response Questions
Question
Refer to the graph provided to answer the following questions.
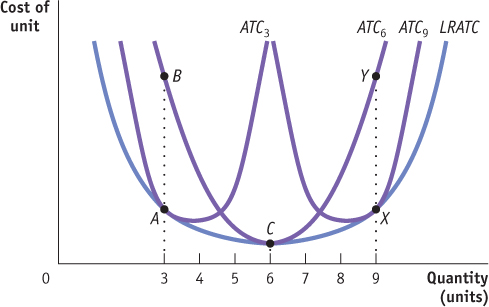
The same level of fixed cost that puts the firm at point B when the quantity is 3 minimizes short-
run average total cost for what output level? At an output level of 3, is the firm experiencing economies or diseconomies of scale? Explain.
In the long run, if the firm expects to produce an output of 9, the firm will produce on which short-
run average total cost curve and at which point on the graph?
Rubric for FRQ 1 (5 points)
1 point: 6
1 point: economies of scale
1 point: Because at an output of 3, the LRATC is decreasing.
1 point: In the long run the firm will produce on ATC9.
1 point: In the long run the firm will produce at point X.
Question
Draw a correctly labeled graph showing a short-
run average total cost curve and the corresponding long- run average total cost curve. On your graph, identify the areas of economies and diseconomies of scale. (5 points) Rubric for FRQ 2 (5 points)
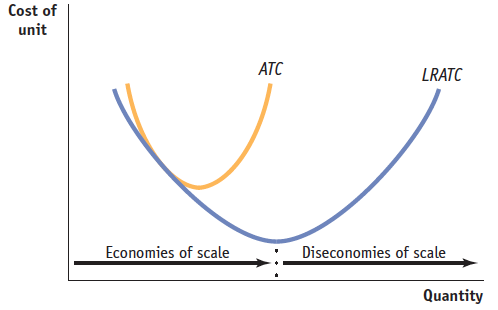
1 point: Graph with “Cost of unit” or “Dollars per unit” on the vertical axis and “Quantity” or “Q” on the horizontal axis
1 point: U-shaped ATC curve labeled “ATC”
1 point: U-shaped LRATC curve labeled “LRATC ” that is below the ATC curve everywhere except at one point, at which the LRATC curve is tangent to the ATC curve
1 point: The area to the left of the minimum point of the long-run average total cost curve is labeled “economies of scale.”
1 point: The area to the right of the minimum point of the long-run average total cost curve is labeled “diseconomies of scale.”