Tackle the Test: Free-Response Questions
Question
Draw a correctly labeled graph showing a profit-
maximizing perfectly competitive firm producing at its minimum average total cost. Rubric for FRQ 1 (6 points)
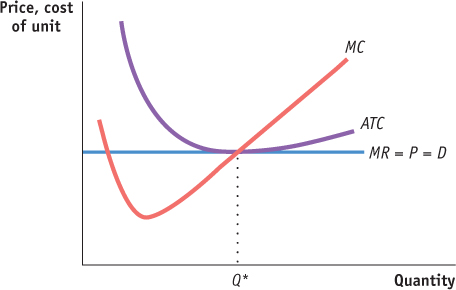
1 point: Vertical axis and horizontal axis labels are correct (“Price, cost of unit” on vertical axis; “Quantity” on horizontal axis).
1 point: The line representing demand, marginal revenue, and price is horizontal and correctly labeled.
1 point: Marginal cost is “swoosh” shaped or upward-
sloping and correctly labeled. 1 point: Average total cost is U-
shaped and correctly labeled. 1 point: Quantity is found where MC = MR.
1 point: Average total cost reaches its minimum point at the profit-
maximizing level of output. (3 points)
Question
Refer to the table provided. Price is equal to $14.
Calculate the firm’s marginal cost at each quantity.
Determine the firm’s profit-
maximizing level of output. Calculate the firm’s profit at the profit-
maximizing level of output. (3 points)
Short- Run Costs for Jennifer and Jason’s Farm Quantity of tomatoes (bushels) Variable cost Total cost 0 $0 $14 1 16 30 2 22 36 3 30 44 4 42 56 5 58 72 6 78 92 7 102 116 Rubric for FRQ 2 (3 points)
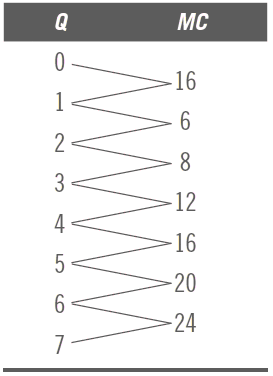
1 point: Correct marginal cost values as shown in the table above.
1 point: The profit-maximizing quantity is 4.
1 point: The firm’s maximum profit is
TR − TC = (4 × $14) − $56 $56 − $56 = $0.