Tackle the Test: Free-Response Questions
Question
Draw a correctly labeled graph showing a perfectly competitive firm producing and incurring a loss in the short run.
Rubric for FRQ 1 (10 points)
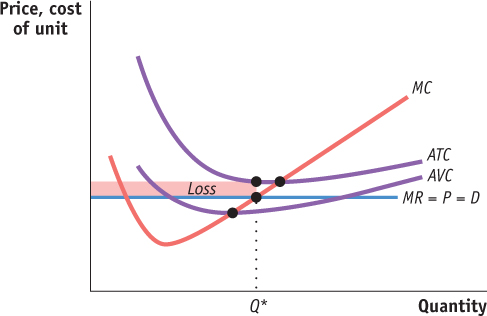
1 point: Vertical axis is labeled “Price, cost of unit” or “Dollars per unit”; horizontal axis is labeled “Quantity” or “Q.”
1 point: Demand curve is horizontal and labeled with some combination of “P,” “MR,” or “D.”
1 point: MC is labeled and slopes upward in the shape of a swoosh.
1 point: Profit-
maximizing quantity is labeled (for example, as “Q*”) on the horizontal axis where MC = MR. 1 point: ATC is labeled and U-
shaped. 1 point: ATC is above price at the profit-
maximizing output. 1 point: MC crosses ATC at the lowest point on ATC.
1 point: AVC is labeled and U-
shaped. 1 point: AVC is below price at the profit-
maximizing output. 1 point: Loss rectangle is correctly located and identified.
Question
Refer to the graph provided.
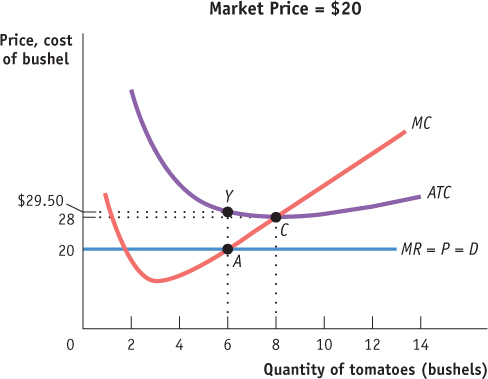
Assuming it is appropriate for the firm to produce in the short run, what is the firm’s profit-
maximizing level of output? Calculate the firm’s total revenue.
Calculate the firm’s total cost.
Calculate the firm’s profit or loss.
If AVC were $22 at the profit-
maximizing level of output, would the firm produce in the short run? Explain why or why not. (5 points)
Rubric for FRQ 2 (5 points)
1 point: 6, where MR = MC
1 point: $20 × 6 = $120
1 point: $29.50 × 6 = $177
1 point: $120 − $177 = − $57 (or a loss of $57)
1 point: No, because P < AVC