Tackle the Test: Free-Response Questions
Question
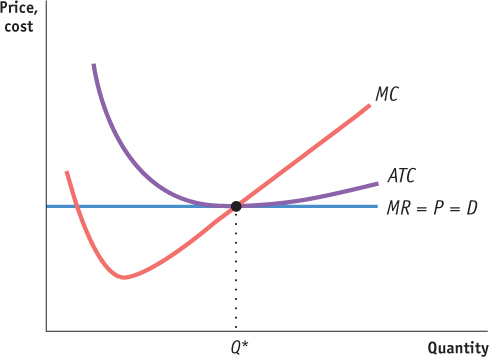
Draw a correctly labeled graph showing a perfectly competitive firm in long-
run equilibrium. Rubric for FRQ 1 (7 points)

1 point: Axes are correctly labeled.
1 point: Demand curve is horizontal and labeled with some combination of “P,” “MR,” or “D.”
1 point: Marginal cost curve is labeled and slopes upward.
1 point: Profit-
maximizing quantity is labeled on horizontal axis where MC = MR. 1 point: Average total cost curve is labeled and U-
shaped. 1 point: Average total cost is equal to price at the profit-
maximizing output. 1 point: Marginal cost curve crosses the average total cost curve at the lowest point on the average total cost curve.
Question
Suppose that paper is produced in a perfectly competitive, increasing-
cost industry. Draw correctly labeled side-
by- side graphs for a representative firm and for the paper market in long- run equilibrium. Label the market equilibrium price “PM1” and the equilibrium quantity “QM1.”
Label the firm’s marginal cost “MC1,” its average total cost “ATC1,” its demand curve “DF1,” and its profit-
maximizing price and quantity “QF1” and “PF1,” respectively.
Now suppose that increased reliance on digital communications causes a decrease in the demand for paper. Show the following on the graphs you drew for part (a):
The new short-
run market equilibrium price and quantity, labeled “PM2” and “QM2.” The new short-
run profit- maximizing price and quantity for the representative firm, labeled “PF2” and “QF2.”
Now suppose the market and the representative firm have adjusted to a new long-
run equilibrium. Label the new equilibrium market price and quantity “PM3” and “QM3.”
Explain how and why the representative firm’s new average total cost curve differs from ATC1.
Draw the long-
run supply curve for the market and label it “LRS.” (8 points)
Rubric for FRQ 2 (8 points)
1 point: Correctly labeled graph of the market with an upward-sloping supply curve, a downwardsloping demand curve, and the equilibrium price and quantity, PM1 and QM1
1 point: The firm’s profit-maximizing quantity, QF1, is shown on the quantity axis below the intersection of MC1 and DF1, which is horizontal at PF1.
1 point: The firm’s average total cost curve, ATC1, is tangent to DF1 above QF1.
1 point: The market demand curve shifts leftward and the new short-run equilibrium price and quantity are labeled PM2 and QM2.
1 point: The firm’s demand curve shifts downward and the profit-maximizing price and quantity for the firm are labeled PF2 and QF2.
1 point: The market supply curve shifts leftward and the new equilibrium price and quantity are labeled PM3 and QM3.
1 point: The firm’s average total cost curve shifted down below ATC1 because, when the size of an increasing-cost industry decreases, the resulting decrease in the demand for inputs leads to a decrease in the cost of those inputs.
1 point: The long-run supply curve slopes upward and goes through the points (QM3, PM3) and (QM1, PM1).