Check Your Understanding
Question
Use the accompanying total revenue schedule of Emerald, Inc., a monopoly producer of 10-
carat emeralds, to calculate the items listed in parts a– d. Then answer part e. Quantity of emeralds demanded Total revenue 1 $100 2 186 3 252 4 280 5 250 the demand schedule (Hint: the average revenue at each quantity indicates the price at which that quantity would be demanded.)
The demand schedule is found by determining the price at which each quantity would be demanded. This price is the average revenue, found at each output level by dividing the total revenue by the number of emeralds produced. For example, the price when 3 emeralds are produced is $252/3 = $84. The price at the various output levels is then used to construct the demand schedule in the table at the bottom of the page.the marginal revenue schedule
The marginal revenue schedule is found by calculating the change in total revenue as output increases by 1 unit. For example, the marginal revenue generated by increasing output from 2 to 3 emeralds is ($252 – $186) = $66.the quantity effect component of marginal revenue at each output level
The quantity effect component of marginal revenue is the additional revenue generated by selling one more unit of the good at the market price. For example, as shown in the table below, at 3 emeralds, the market price is $84; thus, when going from 2 to 3 emeralds, the quantity effect is equal to $84.the price effect component of marginal revenue at each output level
The price effect component of marginal revenue is the decline in total revenue caused by the fall in price when one more unit is sold. For example, as shown in the table below, when only 2 emeralds are sold, each emerald sells at a price of $93. However, when Emerald, Inc. sells an additional emerald, the price must fall by $9 to $84. Thus, the price effect component in going from 2 to 3 emeralds is ( – $9) × 2 = – $18. That’s because 2 emeralds can only be sold at a price of $84 when 3 emeralds in total are sold, although they could have been sold at a price of $93 when only a total of 2 were sold.What additional information is needed to determine Emerald, Inc.’s profit-
maximizing output? In order to determine Emerald, Inc.’s profit-maximizing output level, you must know its marginal cost at each output level. Its profit-maximizing output level is the one at which marginal revenue is equal to marginal cost.
Question
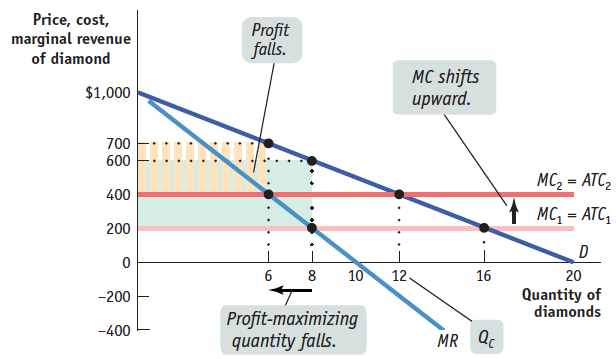
Replicate Figure 61.3 and use your graph to show what happens to the following when the marginal cost of diamond production rises from $200 to $400. Use the information in Table 61.1 to identify specific numbers for prices and quantities on your graph.
the marginal cost curve
the profit-
maximizing price and quantity the profit of the monopolist
the quantity that would be produced if the diamond industry were perfectly competitive, and the associated profit
As the diagram on the bottom left shows, the marginal cost curve shifts upward to $400. The profit-maximizing price rises from $600 to $700 and quantity falls from 8 to 6. Profit falls from $400 × 8 = $3,200 to $300 × 6 = $1,800. The quantity that a perfectly competitive industry would produce decreases from 16 to 12, and profit remains unchanged at zero.
Quantity of emeralds demanded Price of emerald Total revenue Marginal revenue Quantity effect component Price effect component 1 $100 $100 2 93 186 $86 $93 -$7 3 84 252 66 84 -18 4 70 280 28 70 -42 5 50 250 -30 50 -80