Tackle the Test: Free-Response Questions
Question
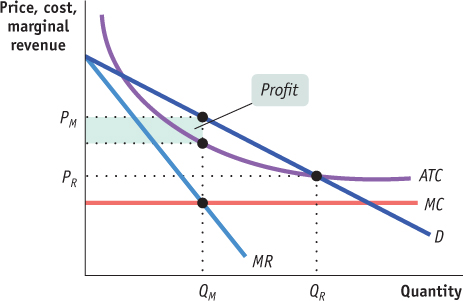
Draw a correctly labeled graph showing a profit-
making natural monopoly. On your graph, indicate each of the following: the monopoly’s profit-
maximizing output (QM ) the monopoly’s price (PM )
the monopoly’s profit
the regulated price that would maximize consumer surplus without creating losses for the firm (PR)
Rubric for FRQ 1 (9 points)
1 point: The axes are correctly labeled.
1 point: The demand curve is labeled and sloped downward.
1 point: The marginal revenue curve is labeled, sloped downward, and below the demand curve.
1 point: The average total cost curve is labeled and downward-
sloping (not U- shaped!). 1 point: The marginal cost curve is labeled and below the average total cost curve (it does not need to be flat).
1 point: The profit-
maximizing output, QM, is shown on the horizontal axis where MC = MR. 1 point: The profit-
maximizing price is found on the demand curve above the point where MC = MR. 1 point: The monopoly profit area is correctly shaded and labeled.
1 point: The regulated price is labeled on the vertical axis to the left of the point where the demand curve crosses the average total cost curve.
Question
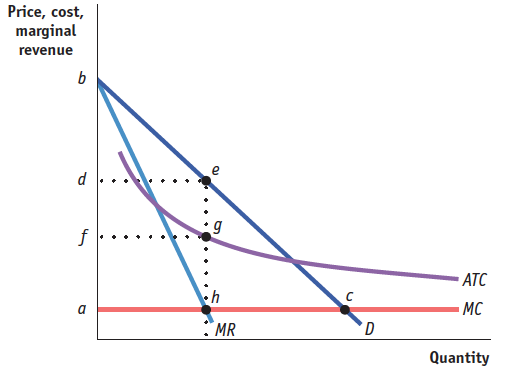
Draw a correctly labeled graph of a natural monopoly. Use your graph to identify each of the following:
consumer surplus if the market were somehow able to operate as a perfectly competitive market
consumer surplus with the monopoly
monopoly profit
deadweight loss with the monopoly (8 points)
Rubric for FRQ 2 (8 points)
1 point:1 point : Axes are correctly labeled as “$ per unit” or “Price, cost, marginal revenue” and “Quantity.”
1 point: The demand curve is labeled and downward-sloping, and the marginal revenue curve is labeled, downward-sloping, and below the demand curve.
1 point: The average total cost curve is labeled and downward-sloping.
1 point: The marginal cost curve is labeled and below the average total cost curve (but not necessarily flat).
1 point: An area analogous to triangle bca in the graph above is identified with shading or letters as the consumer surplus with a perfectly competitive market.
1 point: An area analogous to triangle bed is identified with shading or letters as the consumer surplus with the monopoly.
1 point: An area analogous to rectangle degf is identified with shading or letters as the monopoly profit.
1 point: An area analogous to triangle ech is identified with shading or letters as the deadweight loss with the monopoly.