Free-Response Questions
Question
The hot dog stand industry in Frankland is monopolistically competitive. A typical stand produces and sells 10,000 hot dogs during the summer season. For that stand, the price per hot dog is $3.00, the average total cost is $1.00 at the current production level, and the marginal cost is $0.50 at the current production level.
Draw a correctly labeled graph of this typical hot dog stand under current market conditions, labeling the equilibrium quantity and the equilibrium price with the numbers provided.
Calculate the economic profit or loss for the typical hot dog stand.
On your graph from part a, shade in the area of the profit or loss.
Now assume that the government imposes a $20,000 lump sum license fee for the summer season.
What happens to the price and quantity for the typical hot dog stand as a result of the license fee? Explain.
Show the impact of the license fee on the graph from part a and provide a clear label for anything that changed.
What will happen to the number of hot dog stands over the course of the season? Explain. (10 points)
Rubric for FRQ 1 (10 points)
1 point: Graph with “Price, cost, marginal revenue” or “$ per unit” on the vertical axis and “Quantity of hot dogs” on the horizontal axis. The average total cost curve is U-shaped and the marginal cost curve is swoosh-shaped. 1 point: Downward-sloping demand curve with the marginal revenue curve below it1 point: The quantity below the intersection of marginal cost and marginal revenue is labeled 10,000 and the price at the height of the demand curve at the equilibrium quantity is labeled $3.00.1 point: Profit = ( P − ATC ) × Q = ($3 − $1) × 10,000 = $20,0001 point: The rectangle ( P − ATC ) × Q is shaded, as shown in the graph.1 point: Price and quantity remain the same.1 point: The license fee is a lump-sum tax and therefore a fixed and sunk cost that does not affect marginal cost, marginal revenue, or demand—the two determinants of price and quantity. The exception would be if the license fee caused a firm to close, but that does not occur in this case because the firm earns a normal profit after paying the tax.1 point: The average total cost curve shifts up to the point of tangency with the demand curve (while the other curves remain the same).1 point: The number of hot dog stands will remain the same.1 point: A typical stand earns zero economic profit with the license fee and thus is in long-run equilibrium—there is no incentive for exit or entry.Question
The following diagram shows the pricing strategies and payoffs for the two bubble gum firms in town.
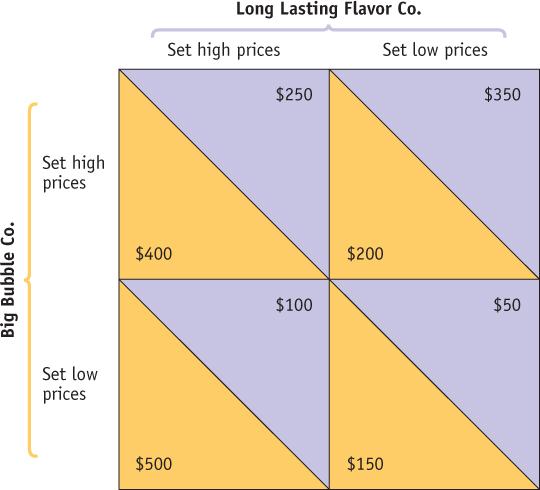
Does Big Bubble Co. have a dominant strategy? Explain.
Does Long Lasting Flavor Co. have a dominant strategy? Explain.
Does this situation have any Nash equilibria? Explain.(6 points)
Rubric for FRQ 2 (6 points)
1 point:There is no dominant strategy for Big Bubble Co.
1 point:The best strategy for Big Bubble Co. depends on the strategy chosen by Long Lasting Flavor Co.
1 point:There is no dominant strategy for Long Lasting Flavor Co.
1 point:The best strategy for Long Lasting Flavor Co. depends on the strategy chosen by Big Bubble Co.
1 point:There are 2 Nash equilibria: (1) Big Bubble Co. sets high prices and Long Lasting Flavor Co. sets low prices; and (2) Big Bubble Co. sets low prices and Long Lasting Flavor Co. sets high prices.
1 point:These combinations of strategies are Nash equilibria because in each case, neither firm has an incentive to change its pricing decision given what its competitor is doing.